IB with Range PercentageThis Pine Script indicator for TradingView combines several powerful technical analysis tools to give traders a comprehensive view of market action:
Inside Bar Detection: Identifies the classic inside bar candlestick pattern.
Moving Averages: Provides multiple moving averages to help determine trend and potential support/resistance levels.
Information Table: Displays key market data in a concise table format.
1. Inside Bar Detection and Range
The indicator marks inside bars on the chart. An inside bar is a candlestick where its entire range (high and low) falls within the range of the preceding candlestick (often called the "mother bar"). This pattern often signifies market consolidation or indecision.
Customizable Marking: Users can choose the shape and color used to mark the inside bars, such as triangles, squares, or circles.
Range Percentage: A label shows the range of the inside bar as a percentage of the previous bar's low, providing a quantitative measure of its size.
Time Restriction: A setting allows displaying inside bars only for a specified number of past days, focusing analysis on recent price action.
Customizable Label Size: Users can choose the size of the range percentage label for optimal visibility.
2. Moving Averages for Trend Analysis
The indicator can plot up to four moving averages (MAs) on the chart. Moving averages smooth out price data to help identify trends and potential support and resistance levels.
User-Selectable MA Type: For each MA, traders can choose between Simple Moving Average (SMA) or Exponential Moving Average (EMA).
Customizable Length: Users can specify the length (number of periods) for each MA, such as 20, 50, 100, or 200.
Customizable Color: Each MA's line color can be chosen to suit personal preferences.
Trend Identification: When the price is above an MA, it suggests an uptrend, while prices below suggest a downtrend. The slope of the MA also indicates trend momentum.
3. Information Table for Key Data
A customizable information table is displayed on the chart, providing a quick overview of important market data.
Average Daily Range (ADR) Percentage: Shows the average daily range of the asset as a percentage, reflecting its historical volatility.
Distance from EMAs: Displays how far the current price is from the 10, 20, and 50 period Exponential Moving Averages. A positive percentage indicates the price is above the MA, while a negative percentage means it's below.
Customizable Table Elements: Users can choose the table's background color, text color, and text size for optimal readability.
How to Use This Indicator:
This indicator can be a valuable tool for traders using technical analysis:
Inside Bar Breakouts: Inside bars often precede breakouts. Traders can use the inside bar markings and range percentage to identify potential breakout opportunities.
Confirmation of Trends: Moving averages help confirm the direction of the trend, enabling traders to align their inside bar strategies with the prevailing market direction.
Support and Resistance: Moving averages can act as dynamic support and resistance levels. Traders can look for inside bars forming near these levels as potential entry or exit points.
Volatility and Range Analysis: The ADR percentage helps assess the normal daily range of an asset, which can be useful for setting realistic price targets and managing risk.
Risk Management: The distance from EMAs can alert traders to potential overextended moves, providing information for setting stop-loss or take-profit levels.
By combining these elements, this indicator provides a layered approach to market analysis, allowing traders to identify potential trading opportunities and manage risk effectively based on both candlestick patterns and trend-following indicators. Remember that no indicator guarantees success, and it's essential to use this tool in conjunction with other analysis techniques and proper risk management practices.
在腳本中搜尋"inside bar"

Inside/Outside Bar Direction Highlighter
Here’s a trading indicator in Pine Script (v6) that combines the essence of the Inside Bar, Outside Bar, and directional patterns inspired by TT3 Theory. This indicator highlights bars based on their classification as inside, outside, or directional and provides potential trade signals.
Inside Outside Indicator
Explanation:
Bar Classification:
Inside Bar: Current high is less than the previous high, and the low is greater than the previous low.
Outside Bar: Current high exceeds the previous high, and the low breaks below the previous low.
Up/Down Bars: Closing prices relative to the previous high/low.
Visual Highlights:
Bars are visually highlighted with colors for easy identification.
Trade Signals:
Long Signal: When the close crosses above the previous high and it's a directional up bar.
Short Signal: When the close crosses below the previous low and it's a directional down bar.
Customizable Inputs:
Colors for inside, outside, up, and down bars can be modified.
You can copy and paste this script into the Pine Editor on TradingView to see it in action. Adjust the logic to fit your trading strategy as needed.
You said:
summary of how to use this indicator without buy/sell signal
ChatGPT said:
ChatGPT
How to Use the Inside/Outside Bar Direction Highlighter Indicator (Without Buy/Sell Signals)
Understand the Bar Classifications:
Inside Bars: Highlighted in blue (default). These indicate periods of market consolidation. Look for potential breakouts in either direction.
Outside Bars: Highlighted in orange (default). These represent increased volatility, where both higher highs and lower lows are made. Watch for reversals or continuations based on broader trends.
Directional Up Bars: Highlighted in green (default). These occur when the current close is above the previous high, signaling bullish momentum.
Directional Down Bars: Highlighted in red (default). These occur when the current close is below the previous low, indicating bearish momentum.
Identify Key Patterns:
Use the highlighted bars to spot price action setups, such as:
Breakouts from inside bars.
Reversal signals following outside bars.
Continuation patterns when directional bars align with the trend.
Combine with Your Analysis:
Trend Analysis: Match bar classifications with trend direction on larger timeframes (e.g., daily, 4-hour).
Support/Resistance: Use inside and outside bars near key levels for confirmation or reversal signals.
Volume: Higher volume on directional bars strengthens the momentum signal.
Customize the Colors:
Adjust the bar highlight colors to fit your chart theme for better visibility.
No Automatic Signals:
This indicator doesn’t provide explicit buy/sell recommendations. Instead, use the visual highlights to make informed decisions based on your trading strategy.
By interpreting these bar patterns, you can better gauge market behavior and make more confident decisions without relying on preset signals.

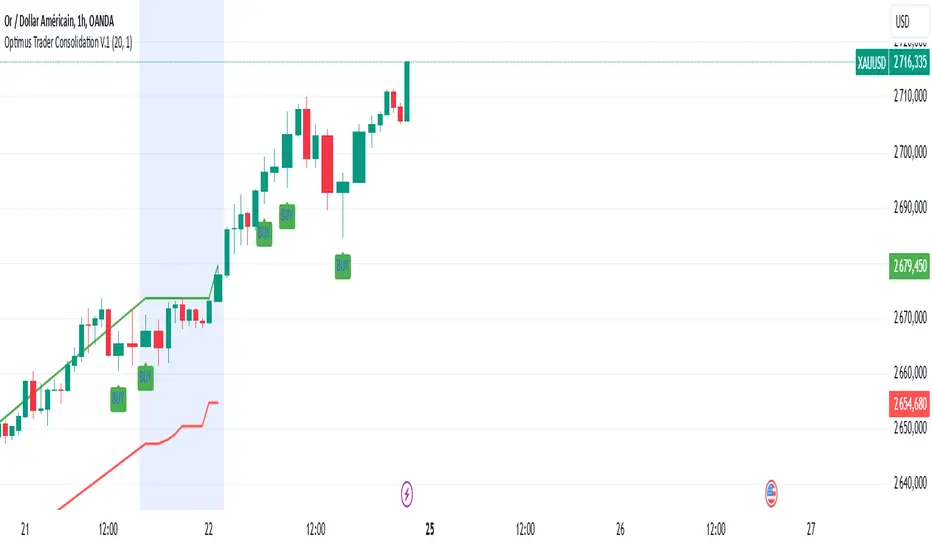
AQPRO Block Force
📝 INTRODUCTION
AQPRO Block Force is a powerful trading tool designed to identify and track Orderblocks (OBs) in real-time based on Fair Value Gap (FVG) principles. This indicator employs quite strict yet effective FVG filtering criteria to ensure only significant OBs are displayed, avoiding minor inefficiencies or duplicates within the same impulse or corrective moves. Each OB adapts dynamically to price action and can be categorized as Classic, Strong, or Extreme, based on proprietary conditions and best ideas from SMC (Smart Money Concepts).
In addition to plotting Orderblocks, the indicator offers useful filtering systems like an Age Filter to ensure cleanliness of the OB data on the chart and prevent old, irrelevant OBs from obstructing the chart. Users can also enable MTF (Multi-Timeframe) functionality to view OBs from other timeframes, providing a comprehensive analysis across multiple levels of market structure. With extensive customization options, AQPRO Block Force allows traders to tailor the visuals and behavior to fit their specific trading preferences.
This indicator does not parse any instituotinal data, order books and other fancy financial sources for finding order blocks nor it uses them for confirmation purposes. Calculations algorithms of order blocks are based purely on current asset's price history.
IMPORTANT NOTE: in the sections below term 'quality' will be applied to orderblocks quite a number of times. By 'quality' in the context of orderblocks we mean the reaction of price upon the sweep of orderblock. Basically, if the price reverses after reaching the orderblock, this orderblock is considered to be of high quality. Definition for low -quality orderblock can be deducted by analogy.
🎯 PURPOSE OF USAGE
This indicator serves one and only purpose — help traders identify most lucrative institutional orderblocks on the chart in real time. Even though event of price reaching an orderblock cannot be considered as a sole signal in many trading strategies without proper confirmation, such event nevertheless is quite important in SMC-based trading, because when price sweeps OB it usually means, that a reversal will soon follow, but, of course, this is not the case every time.
Traders should not expect from this indicator detection of perfect orderblocks, which would surely revese the price on encounter, but they can expect is a time-proven algorithm of determing orderblocks that on average produces more high-quality orderblocks than simple similar tools from open-source libraries.
More in-depth advices on the usage will be given in the sections below, but for now let's summarise subgoals of the indicator:
Detecting orderblocks filtered through strict FVG validation rules to improve overall quality of orderblocks;
Classifying orderblocks as Classic, Strong, or Extreme based on wether or not classic orderblocks pass filtering conditions, which are based on crossing critical price levels and SMC principles like ChoCh (Change of Character);
Eliminating clutter and manage chart space with the Age Filter, removing old OBs outside a user-defined age range;
Utilizing MTF functionality to track significant OBs from other timeframes alongside current timeframe analysis;
Providing traders with customization options for indicator's visuals to help them organize information on the chart in a clean way.
⚙️ SETTINGS OVERVIEW
This indicator's customization options allow you to fully control its functionality and visuals. Below is a breakdown of the settings grouped by the exact setting sections and parameters from the indicator:
🔑 Main Settings
Show OBs from current timeframe — toggles the display of OBs from the current timeframe on the chart;
Show classic OBs — enables or disables the display of Classic OBs;
Show strong OBs — enables or disables the display of Strong OBs, which meet the ChoCh-based filter criteria;
Show extreme OBs — enables or disables the display of Extreme OBs, which exceed proprietary price level risk thresholds.
⏳ Filter: Age
Use Age Filter — toggles the Age Filter, which removes old OBs based on their age;
Max Age — sets the maximum age of OBs to be displayed (in bars). OBs older than this value will be hidden;
Min Age — sets the minimum age of OBs to be displayed (in bars). OBs younger than this value will not be shown.
🌋 MTF Settings
Show MTF OBs — toggles the display of OBs from higher timeframes;
Timeframe — select the timeframe to use for MTF OB detection (e.g., 15m, 1h).
⏳ MTF / Filter: Age
Use Age Filter (MTF) — toggles the Age Filter for MTF OBs;
Max Age — sets the maximum age of MTF OBs to be displayed (in bars);
Min Age — sets the minimum age of MTF OBs to be displayed (in bars).
🎨 Visual Settings
Classic OB (Bullish) — sets the color for bullish Classic OBs;
Classic OB (Bearish) — sets the color for bearish Classic OBs;
Strong OB (Bullish) — sets the color for bullish Strong OBs;
Strong OB (Bearish) — sets the color for bearish Strong OBs;
Extreme OB (Bullish) — sets the color for bullish Extreme OBs;
Extreme OB (Bearish) — sets the color for bearish Extreme OBs.
📈 APPLICATION GUIDE
Application methodology of this indicator is pretty much the same as with any other indicator, whose purpose is to find and display orderblocks on the chart. However, before actually diving into the guide on application, we want to make a small step back to remind traders of the history of orderblocks as a concept, its limitations and benefits.
Orderblocks themselves are essentially just zones of potential institutional interest, which if reached are expected to reverse the price in the opposite direction. 'Potential' is a suitable remark for indicator's success probability, because, as was mentioned above, orderblocks don't guarantee price reversal regardless of quality of the indicator. This is the case for the simplest of reasons — orderblocks are based solely on price history and thus are to be considered a mathematical model , degree of success of which is never 100%, because all mathematical models abide by a "golden rule of trading" : past performance doesn't guarantee future results.
However, the extensive history of orderblocks clearly shows that this tool, despite being decades old, can still help traders produce market insights and improve any strategy's performance. Orderblocks can be used both as a primary source of signals and as confirmation tool, but from our experience they are better to be used as confirmation tool. Our indicator is not an exception in this matter and we advice any trader to use it mainly for confirmation purposes, because use-case of orderblocks as confirmation tools have much success stories on average than being used as primary signal source.
This being said, let's return to the application guide and start reviewing the indicator from the most basic step — how it will look like when you first load it on your chart:
This indicator consisis of 3 main logic blocks:
Orderblock evaluation;
MTF Orderblock evaluation;
Orderblock post-filtering.
The principles behind these logic blocks will be easy to understand for truly experiences traders, but we understand the need to explain them to a wider audience, so let's review each of these logic blocks below.
ORDERBLOCK EVALUATION
Principles behind our orderblock detection logic are as follows:
Find FVG (Fair Value Gap) .
Note: this indicator uses only three-candle FVGs and doesn't track FVGs with insidebars after third (farther) candle.
If you don't know what FVG means, we recommend researching this term in the Internet, but the basic explanation is this: FVG is the formation of candles, which are positioned in a way that there are an unclosed price area between 1st and 3rd candle.
Conditions:
bullish FVG = high of 3rd candle < low of 1st candle AND high of 3rd candle < close of 2nd candle AND high of 2nd candle < close of 1st candle AND low of 3rd candle < low of 2nd candle ;
bearish FVG = low of 3rd candle < high of 1st candle AND low of 3rd candle > close of 2nd candle AND low of 2nd candle > close of 1st candle AND high of 3rd candle > high of 2nd candle .
See visual showcase of valid & invalid bullish & bearish FVGs on the screenshot below:
As was shown on the screenshot above, the only correc t formation for FVGs are considered to be just like on pictures 1 and 2 (leftmost column of patterns) . Only these formations will take part in further determenings orderblocks.
Send FVGs through filtering conditions.
This is the truly important part. Without properly filtering FVGs we would get huge clusters of FVGs on the chart and they will not make sense to be reviewed, because there will be just too much of them and their quality will be very questionable .
Even though there is a quite number of ways to filter FVGs, we decided to go with the ones we deem actually useful. For this indicator we chose two methods, that work in tandem — 1) base candle's inside bar condition and 2) single appearance on current impulse/correction line. Let's review these conditions below and start with looking at the examples of them on the screenshot below:
Examples of 1st & 2nd conditions are displayed on the left and right charts respectively.
The filtering logic in 1st and 2nd is quite connected and further explanation should help you understand it just enough to start trading with our indicator.
Let's start with explaining the term 'base candle' and logic behind it. Base candle candle be explained quite shortly: it is the latest candle on the chart, whose high or low broke previous base candle's high or low respectively. The first candle in the time series of price data is by default considered the base candle. If any new candle after base candle doesn't overtake base candle's high or low (meaning, that this candle is inside the range of base candle), such candle is called an "inside bar" .
Inside bar's term is important to understand, because FVGs, which appear inside the inside bars are usually quite useless, because price doesn't react from them, so orderblocks with such FVGs are also of bad quality as well. Clear depiction of inside bar was provided in the screenshot of conditions above on the left chart, so we won't waste time making another example.
However, this is not it. Base candle, inside bars and a few other types of bars are all a part of SMC ideas and in the world of SMC there is a special term, that hold the most important place and is considered the cornerstone of SMC methodology — impulse/correction lines (valid pullbacks) . The average definition of impulse/correction lines is quite hard to understand for an average trader, but we can summarise like this:
Impulse/correction line is a line, that starts at the beginning of the sequence of base candles, each new candle of which consistently updates previous base candle's respective high/low.
We won't go into description of this principle because it is outside of scope of this indicator, but you can research this topic in the Internet by keywords ' impulse correction trading ' or 'valid pullback principles trading '. The general idea of usage of impulse/correction lines in the context of this indicator is that each such lines 'holds' inside at least one FVG and we need to find exactly the first FVG, while leaving all other FVGs behind, because they to be of worse quality on average.
Basically, by using translating these terms into conditions from example above, we have achieved a simple yet powerful filtering system. system for FVGs, which allows us to work with orderblocks of much higher quality than average open-source indicators.
If FVG passed filters, evaluate its OB.
When FVG is confirmed, we can start the evaluation of its orderblock. The evaluation of orderblocks consists of several checkpoints: 1) is orderblock beyond current ChoCh* AND/OR 2) is orderblock from extreme price levels, calculated by our proprietary risk system. Let's review these checkpoints below.
* ChoCh (Change of Character, fundamental SMC idea) — price level, which if broken by close of price can potentially cause a revesal of the trend to direction opposite to the the previous one. To learn more about ChoCh please research the term on the Internet, because this indicator uses its standard definition and explaining of this term goes beyond the scope of this indicator.
To determine if orderblock is beyond current ChoCh levels, we need to first determine where these levels are on the chart. ChoCh levels of this indicator are calculated with a very lite approach, which is based on pivot points.
You can see basic demonstration of ChoCh levels in action on the screenshot below:
IMPORTANT NOTE: pivot period for pivots points inside our indicator is by default equal to 5 and cannot be changed in settings at the moment of publication.
On the screenshot above you can clearly see that ChoCh levels are essentially highest/lowest pivot point levels in between certain range of bars, where price doesn't update its extremum. You can see on there screenshot a new type of line — BoS (Break of Structure). BoS is almost the same thing as ChoCh, but with one change: it is a confirmation of price updating its extremum in the same direction as it was before, while ChoCh updates price extremum in the direction opposite to which it was before .
Why do these levels matter when evaluating the orderblocks? Orderblocks, which are located beyond current BoS/ChoCh levels, are of much higher quality on average than average orderblocks and they are called Strong Orderblocks .
On the chart such orderblocks are marked with 'Strong OB' label inside the body of an orderblock.
You can see the examples of Strong OBs on the screenshot below:
That was the explanation of the 1st orderblock evaluation criteria. Now let's talk about the 2nd one.
Our 2nd evaluation criteria for orderblocks is a test on whether or price is behind specific price level, which is calculated by our proprietary risk system, which is based on fundamental of statistics, such as 'standard deviation' and etc.
This criteria allows us to catch orderblocks, which are located at quite extreme price levels, and mark them on trader's chart explicitly. Orderblocks, which are above our custom price levels, are called Extreme Orderblocks an are marked with 'Extreme OB' label inside orderblock's body.
You can see the example of Extreme OB on the screenshot below:
That was the explanation of the 2nd evaluation criteria of the orderblock.
If an orderblock doesn't pass any of these two criterias, it is considered a classic orderblock. These orderblock are most common ones and have the lowest success rate among other types of orderblocks, listed above. Such orderblocks are marked with 'OB' label inside the orderblock's body.
You can see the examples of classic OB on the screenshot below:
This is it for orderblock evaluation logic. After doing all these steps, all orderblocks that we found are collected and displayed on the chart with their bodies and label marks.
What happens after the detection of the orderblocks?
All active orderblocks are being tracked in real time and their statuses are being updated as well (Strong orderblock can become Extreme orderblock and vice versa) . By an active orderblock we mean an orderblock, which wasn't swept by price's high or low. Bodies of active orderblocks are prolonged to the next candle on each new candle.
If an orderblock was swept, indicator will stop prolonging this orderblock and will mark it as swept on the chart with almost hollow body and dashed border line of the orderblock's body. Also swept orderblocks lose their name label, so you won't see any text in the orderblock after it was swept, but you will see its colour.
You can see the example of an active & swept orderblocks on the screenshot below:
This functionality helps distinguish active orderblocks from swept ones (inactive) and make more informed decisions.
MTF OB EVALUATION
Principles of MTF OBs evaluation are exactly the same as they are for current timeframe's OBs.
MTF OBs are displayed on the chart in same way as other OBs, but with one little change: to the right side of MTF OB's status will be postfix of the timeframe, from which this OB came from. Timeframe for MTF OBs can be chosen by user in the settings of the indicator.
MTF OBs also preserve their statuses (Strong, Extreme and Classic) when displayed on the current timeframe, so you won't stack of mistakenly marked MTF OBs as Extreme just because they are far away from the price.
You can see the example of MTF OBs on the screenshot below:
Also MTF OBs when swept lose only their name label, but the timeframe postfix will still be there, so you could distinguish MTF OBs from OBs of the current timeframe.
See the example of swept MTF OBs below:
Overall MTF orderblocks is a very useful to get a sense of where the higher timeframe liquidity reside and then adjust your strategy accordingly. Taking your trades from the place of high liquidity, like orderblocks, doesn't guarantee certain solid price reaction, but it definitely provides a trader with much a greater change of 1) catching a decent price move 2) not losing money white trading against institutional players.
As was stated above, we recommend using this tool as a confirmation system for your main trading strategy, because its usage as primary source of signals in the long-run is not viable, judging from historical backtest results and general public opinions of traders.
ORDERBLOCK POST-FILTERING
To enhance filtering capabilities of this indicator even further, we decided to add two filters, which would help reduce the amount of bad and untradeable orderblocks. These two filters are 1) age filter and 2) cancellation filter. Let's review both of them below.
Talking about the age filter , this filter was designed to help get rid of old orderblocks, which clutter the chart with visual noise and make it harder to find valueable orderblocks. This filter has to parameters: min age and max age . What does age mean in the context of an orderblock? It is the distance between OB's left border's bar and current bar. If this distance is between min age and max age values, such orderblock is considered valid and age filter passes it for further evaluation, but this distance is too short or too long, age filter deletes this orderblock from the chart.
You can the example of an orderblock which didn't pass age filter requirements and was deleted from the chart on the screenshot below:
It is important to mention that the missing orderblock from the right chart will be appear on the chart right when its age will exceed min age parameter of age filter.
The principle of work for max age parameter can be deducted by analogy: if the orderblock's age in bigger than max age value of age filter, this orderblock will be deleted from the chart .
For MTF OBs we decided to their own age filter, so that it won't abide by current timeframe's restrictions, because MTF OBs are usually much older than OB from current timeframe, so they would deleted a lot of time before they even appear on the chart, if they would abide by the age filter of current timeframe.
Default parameters of age filter are "max age = 500" and "min age = 0" . "Min age = 0" means that there is restrictions on the minimum age of orderblocks and they will appear on the chart as soon as the indicator validates them.
That was the explanation of the age filter.
Talking about the cancellation filter , this filter was intended to spot orderblocks which were extremely untradable and visually alert traders about them on the chart. In this indicator this filter works like this: for each orderblock cancellation filter creates a special price level and checks if it was broken by the close of price.
This special price level consists of the farthest border. of the orderblock ( top border for bearish OBs and bottom border for bullish OBs) and a certain threshold, which is added to the farthest border. This threshold is based on the current ATR value of the asset. This filter helps detect the orderblocks which should not be considered for trading, because price has already went too far beyond the liquidity of this orderblock.
Orderblocks, which are spotted by this filter, are marked with '❌' emoji on the price history.
You can see the example of an orderblock which was spotted by the cancellation filter in the screenshot below:
This filter is applied to both current timeframe and MTF timeframe and is NOT configurable in the settings.
🔔 ALERTS
This indicator employs alerts for an event when new signal occurs on the current timeframe or on MTF timeframe. While creating the alert below 'Condition' field choose 'any alert() function call'.
When this alert is triggered, it will generate this kind of message:
// Alerts for current timeframe
string msg_template = "EXCHANGE:ASSET, TIMEFRAME: BULLISH_OR_BEARISH OB at SWEPT_OB_BORDER_PRICE was reached."
string msg_example = "BINANCE:BTCUSDT, 15m: bearish OB at 170000.00 was reached."
// Alerts for MTF timeframe
string msg_template_mtf = "EXCHANGE:ASSET, TIMEFRAME: BULLISH_OR_BEARISH MTF OB at SWEPT_OB_BORDER_PRICE was reached."
string msg_example_mtf = "BINANCE:BTCUSDT, 15m: bearish MTF OB at 170000.00 was reached."
📌 NOTES
These OBs work on any timeframe, but we would advise to to use on higher timeframes, starting from at least 15m, because liquidity from higher timeframe tends to be much valuable when deciding which orderblock to take for a trade;
Use these OBs as a confirmation tool for your main strategy and refrain from using them as primary signal source. Traders, which use SMC-based strategies, will benefit from these orderblocks the most;
We recommend trading only with Strong and Extreme orderblocks, because they are proved to be of much greater quality than classic orderblocks and they work quite well in mid-term and long-term trading strategies. Classic orderblocs can be used for short-term trading strategies, but even in this case these OBs cannot be blindly trusted;
We strongly advise against take for a trading orderblocks, which were spotted by cancellation filter, because they are considered to be voided of liquidity;
Don't forget that you can toggle different types of OBs, MTF settings and visual settings in the settings of the indicator and fine-tune them to your liking.
🏁 AFTERWORD
AQPRO Block Force is an indicator which designed with idea of helping trading save time on automatically detecting valuable orderblocks on the chart, evaluate their strength and filter out bad orderblocks. These employ the best principles of SMC, including FVGs, valid pullbacks and etc. FVGs play the key role in validating the existence of a particular orderblock and work in tandem with valid pullback to determine the maximum amount of true FVGs even in the most cluttered impulse/correction moves of the price. Our filters — Age Filter and Cancellation Filter — enhance the quality of the orderblocks by allowing only the newest and liquid orderblocks to appear on the chart. Additional MTF functionality allow trader to see orderblocks from other timeframe, which can be chosen in the settings, and get a sense of where the global liquidity resides. This indicator will be a useful confirmation tool to any trading strategy, but the SMC traders will surely get the most benefits out of it.
ℹ️ If you have questions about this or any other our indicator, please leave it in the comments.

AL Brooks - Price Action Multi-Signal Suite📘 Price Action Multi-Signal Suite📘
This indicator is a complete visual toolset for traders who use price action principles inspired by Al Brooks-style analysis.
It combines multiple nuanced signals — like first/second entries, breakout failures, trend bias, higher-timeframe context, and dynamic trend channels — into one elegant, customizable interface.
It is built with clarity, flexibility, and actionable precision in mind.
🧠 Core Concepts Behind the Tool
1. Trend Bias with EMA (20 by default)
The indicator calculates a standard EMA (default: 20) to establish trend direction bias.
When price is above EMA, we consider the market to be in a bull trend, and vice versa.
The EMA line changes color dynamically — green (bull), red (bear), gray (neutral).
🟢 Example:
If price is forming higher highs and staying above EMA with strong bull bars, the bias is bullish. In this phase, you're looking for High 1 and High 2 (H1/H2) setups.
2. First and Second Entries (H1/H2 and L1/L2)
High 1 (H1): First pullback in a bull trend after a minor new high.
High 2 (H2): A second attempt to push up after a failed H1.
Low 1 (L1) and Low 2 (L2): Mirror the above logic for bear trends.
📈 Example Trade – H2 Long:
Price breaks out above EMA.
Pulls back and forms an H1, but it fails to break out.
Second push (H2) forms a higher low, then closes strong above previous bar → BUY entry.
📉 Example Trade – L2 Short:
Market is below EMA.
A rally creates L1, fails.
L2 forms and closes below the previous bar low with a bear body → SELL entry.
3. Second Entry Logic (Simplified Swing Count)
This adds context to H2/L2 by ensuring at least two swings occurred in the same direction.
Reduces false signals in choppy markets.
Painted as colored circles (aqua = long, fuchsia = short).
4. Breakout Failure Detection
Detects false breakouts using 10-bar highs/lows:
Failed High Breakout: Price breaks a 10-bar high but closes back inside → potential reversal short.
Failed Low Breakout: Price breaks a 10-bar low but closes back inside → potential long.
🚨 Example:
Price breaks above a recent high but closes below it with a strong bear bar → look for reversal or fade setups.
5. Inside / Outside Bars
Helps recognize compression (inside bars) or volatility expansions (outside bars).
Inside bars often precede breakouts.
Outside bars may signal traps or indecision.
Use these in combination with entry logic. An H2 after an inside bar can signal a strong, clean breakout.
6. Higher Timeframe (HTF) Context
Pulls EMA and trend bias from a higher timeframe (default: 1hr).
Background color indicates HTF bias (adjustable opacity).
Green = HTF uptrend.
Red = HTF downtrend.
🧭 Usage: Trade in the direction of the HTF bias when possible. An H2 with HTF bias bullish adds confluence.
7. Trend Channels (Automatic, Visual)
Dynamically draws trend channel lines based on pivot highs/lows.
These act as support/resistance, visual guides for traps or continuation.
Trendline breakouts or touches often align with H2/L2 setups.
📏 Example:
Price touches lower channel and forms a second entry long (L2) with a strong bull bar → high-quality reversal trade.
⚙️ Customization Options
Toggle each signal component (entries, bias, bars, failures, channels).
Adjust EMA length, HTF resolution, background opacity.
Keep your chart clean and focused on the signals that matter to you.
📊 Trade Example Summary
H2 with HTF Bullish
Trade Setup: Strong bull bar after a failed H1, above EMA
Expected Move: Trend continuation upward
L2 with Channel Hit
Trade Setup: Pullback hits lower trend channel, forms L2
Expected Move: Reversal or scalp down
Failed High Breakout
Trade Setup: Price breaks above a 10-bar high, but reverses and closes inside
Expected Move: Quick fade or reversal short
Inside Bar + H2
Trade Setup: Price compresses into an inside bar, followed by a breakout with H2
Expected Move: Momentum breakout trade
Outside Bar + L2
Trade Setup: Price breaks strongly in one direction (outside bar), second push fails upward, forms L2
Expected Move: Short on weakness
Please note, this is an educational idea and representation of whatever I understood of it.
Historical performances may not be replicable in present/future.
Trade at your own responsibility.
Regards! ^^

IB & Hammer at SMA(20,50|200)IB & Hammer at SMA (20, 50, 200) Breakout/Breakdown Indicator
Overview:
The IB (Inside Bar) & Hammer at SMA Breakout/Breakdown Indicator is designed to identify breakout and breakdown opportunities using Inside Bars (IB) in combination with Simple Moving Averages (SMA 20, 50, 200) as key trend filters. This indicator is useful for traders looking to catch momentum moves after consolidation phases, confirming the trend direction with moving averages.
Indicator Logic:
Inside Bar (IB) Detection:
An Inside Bar is a candlestick that is completely within the range of the previous candle (i.e., lower high and higher low).
Inside Bars indicate consolidation, suggesting a potential breakout.
SMA Trend Confirmation:
The script uses three moving averages (SMA 20, 50, 200) to determine the trend direction.
Bullish trend: Price is above the 50 & 200 SMAs.
Bearish trend: Price is below the 50 & 200 SMAs.
The 20 SMA is used as a dynamic short-term momentum filter.
Breakout & Breakdown Conditions:
Breakout: When price breaks above the Inside Bar’s high, and the trend is bullish (above key SMAs).
Breakdown: When price breaks below the Inside Bar’s low, and the trend is bearish (below key SMAs).
Alerts can be set to notify traders of potential trade opportunities.
Features:
✅ Identifies Inside Bars (consolidation zones).
✅ Uses SMA (20, 50, 200) for trend confirmation.
✅ Breakout/Breakdown signals based on Inside Bar structure.
✅ Customizable Moving Averages & Alerts.
✅ Visual markers for easy trade identification.
How to Use:
Confirm Trend Direction:
If the price is above SMA 50 & 200, look for breakout trades.
If the price is below SMA 50 & 200, look for breakdown trades.
Watch for Inside Bars:
The script highlights Inside Bars with a specific color (configurable).
These bars indicate a low-volatility phase, preparing for a breakout.
Trade on Breakout/Breakdown:
Breakout: Enter long when the price breaks above the Inside Bar’s high (bullish trend).
Breakdown: Enter short when the price breaks below the Inside Bar’s low (bearish trend).

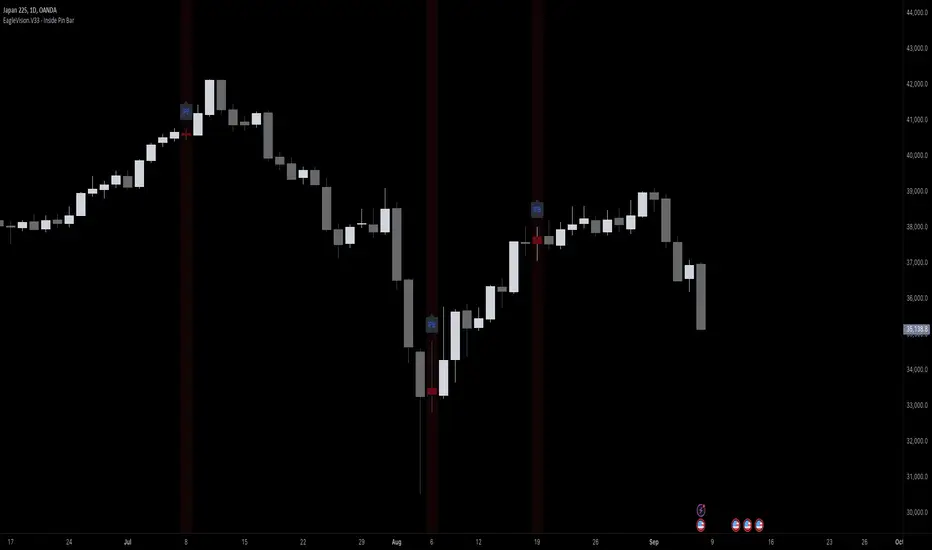
EagleVision.V33 - Inside Pin Bar EagleVision.V33 is a specialized indicator designed for traders who focus on price action. It detects and highlights the Inside Pin Bar candle pattern, a key signal that can indicate potential market reversals or trend continuations. This tool is invaluable for traders who rely on precise candlestick patterns to make data-driven decisions.
Features:
• Customizable Pattern Highlighting: EagleVision.V33 allows traders to choose custom colors to highlight Inside Pin Bar patterns directly on the chart. This makes identifying critical trading signals straightforward, even in busy market conditions.
• Pin Bar Candle Customization: Beyond just highlighting, the indicator enables users to change the color of the detected pin bar itself, ensuring that crucial patterns are immediately visible and easy to track.
• Versatile Timeframe Application: The indicator can be applied across various timeframes, from intraday (1 minute, 5 minutes) to longer-term charts (daily, weekly). Users can easily switch between timeframes within the settings, making it adaptable to different trading strategies.
• Enhanced Visual Clarity with Background Highlighting: For traders who prefer additional emphasis, EagleVision.V33 offers an option to apply a background color that highlights the entire region where the Inside Pin Bar pattern is detected.
How It Works:
• Inside Bar Identification: The indicator first identifies an Inside Bar, where a candle’s high and low fall within the range of the preceding candle (the mother bar). This is a foundational pattern in price action trading.
• Pin Bar Detection: It then checks if the candle is a Pin Bar, characterized by a small body and a prominent wick (either upper or lower), which typically signals potential market turning points.
• Pattern Highlighting & Visualization: Upon detecting both conditions (Inside Bar and Pin Bar), EagleVision.V33 highlights the pattern using customizable shapes and colors, and optionally applies a background shade to further enhance visibility.
Use Cases:
• Reversals at Key Levels: The Inside Pin Bar pattern often appears at significant support or resistance levels, signaling potential reversals. EagleVision.V33 helps traders spot these opportunities early.
• Trend Continuations: In trending markets, this pattern can confirm the continuation of a trend, providing traders with the confidence to hold positions or enter new ones.
Customization Options:
• Pattern Highlight Color: Choose a distinct color for the label or shape that marks the Inside Pin Bar pattern, making it stand out against other chart elements.
• Pin Bar Candle Color: Customize the color of the Pin Bar itself, ensuring that it is immediately recognizable on the chart.
• Background Highlighting: Optionally apply a background color to the chart area where the pattern is detected, further enhancing visual clarity and making it easier to spot potential trading opportunities.
Why EagleVision.V33 Stands Out:
EagleVision.V33 is not just another pattern detection tool; it’s engineered for precision and clarity, with highly customizable features that cater to the unique needs of price action traders. By combining both Inside Bar and Pin Bar detection, it offers a powerful edge, providing traders with actionable insights directly on their charts.
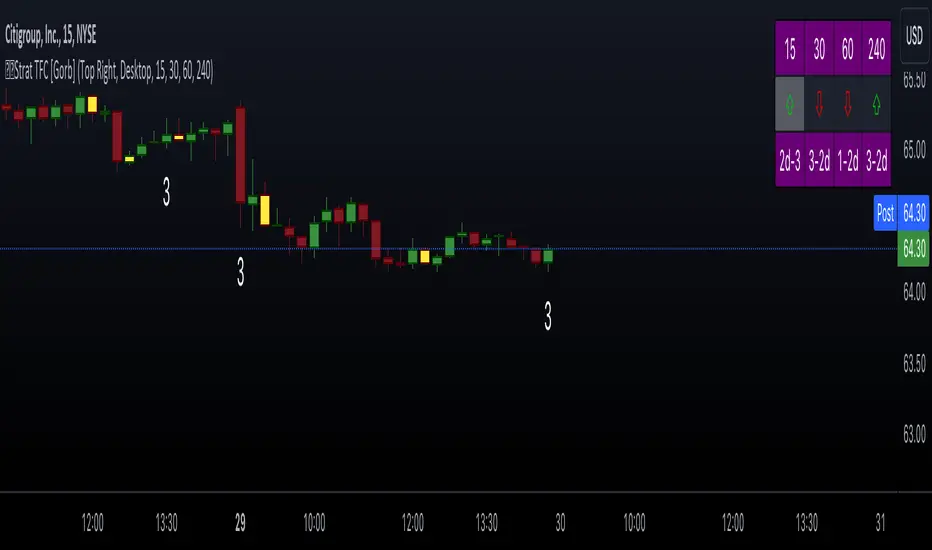
The Strat with TFC & Combo DashIntroduction:
This indicator is designed to implement "The Strat" trading strategy combined with a Timeframe Continuity Dashboard and Combo Dashboard. The Strat is a robust trading methodology that relies on price action and candlestick formations to make trading decisions. This script helps traders to identify specific bar types such as Inside Bars (1), Continuation Up Bars (2u), Continuation Down Bars (2d), and Outside Bars (3) across multiple timeframes. It visually highlights these bar types on the chart and provides a comprehensive dashboard displaying the current state of the selected timeframes.
Key Features:
Timeframe Continuity Dashboard: Displays arrows and bar types for up to four selected timeframes.
Strat Combos Dashboard: Shows the previous and current bar types to easily spot trading setups.
Customizable Colors and Labels: Options to personalize the colors and labels for Inside and Outside bars.
Adjustable Dashboard Position and Size: Allows users to set the location and size of the dashboard for better visual alignment.
Inputs:
TFC & Combo Dash Configuration:
Show TFC & Combo Dashboard: Toggle to display the dashboard.
Show Strat Combos: Toggle to display Strat combo setups.
Location: Dropdown to select the position of the dashboard on the chart.
Size: Dropdown to choose between desktop and mobile view.
Timeframe Selection:
Timeframe 1: Primary timeframe for analysis.
Timeframe 2: Secondary timeframe for analysis.
Timeframe 3: Tertiary timeframe for analysis.
Timeframe 4: Quaternary timeframe for analysis.
Candle Visuals:
Show Inside Bar Label: Option to show label instead of color for Inside bars.
Inside Bar Color: Color picker for Inside bars.
Show Outside Bar Label: Option to show label instead of color for Outside bars.
Outside Bar Color: Color picker for Outside bars.
TFC & Combo DashboardFunctions:
The script fetches values for the selected timeframes and computes the bar types and corresponding visual elements such as arrows and background colors. The dashboard displays this information in a tabular format for easy reference during trading.
The dashboard is dynamically created based on user input for position and size. It shows the selected timeframes, bar types, and combo setups, providing a quick overview of the market conditions across multiple timeframes.
Timeframes: Displays the four user chosen timeframes that the dashboard fetches data from.
Arrow and Color: Functions to set the arrow direction and color based on current bar action. Green and up arrow: price is above it's candle open.
Red and down arrow: price is below it's candles open.
Background Color: Functions to set background color based on the bar type. White for an outside bar(3), yellow for an inside bar(1), no color for a continuation bar(2).
Strat Candle Combos: Functions to determine if the bar is an Inside(1), Continuation Up(2u), Continuation Down(2d), or Outside bar(3). Shows the previous bar and the current bar for the user's chosen timeframes.
Candle Visuals:
The script plots labels and colors for Inside and Outside bars based on user preferences. It helps in quickly identifying potential trading setups on the chart.
Conclusion:
We believe in providing user-friendly tools to help speed up traders technical analysis and implement easy trading strategies. The Strat with TFC & Combo Dashboard is a tool to assist traders in identifying potential trading setups based on The Strat methodology; to suit the users needs and trading style.
RISK DISCLAIMER
All content, tools, scripts & education provided by Gorb Algo LLC are for informational & educational purposes only. Trading is risk and most lose their money, past performance does not guarantee future results.
UntouchedIBOB [DTMM]UntouchedIBOB - Indicator for TradingView
What does this indicator do?
The UntouchedIBOB indicator helps you identify special candlestick patterns on your chart: Inside Bars (IB) and Outside Bars (OB). These patterns can provide important signals for your trading decisions.
The two most important patterns:
Outside Bar (OB) - A candle whose high is higher and low is lower than the previous candle. It completely "engulfs" the previous candle.
Inside Bar (IB) - A candle whose high is lower and low is higher than the previous candle. It moves completely "inside" the previous candle.
Tested and recommended by professionals:
We are the main provider of trading indicators for Oliver Klemm , one of the most renowned traders in Germany and the entire DACH region. Our indicators are used daily in real-money trading by successful professional traders and are continuously improved. You benefit from the same professional technology that is used and recommended by leading market experts.
Main features:
Colored candles: Inside and Outside Bars are displayed in different colors
Lines: Shows horizontal lines at the midpoints of IB/OB that remain active until the price breaks through them
Arrows: Optional arrows above/below the IB/OB for better visibility
Alerts: Can notify you when new Inside or Outside Bars form
Special feature:
The indicator not only shows where IB/OBs are located but also tracks which ones are still "untouched" - meaning the price has not broken through that level again. This can be particularly valuable as untouched IB/OB levels often represent important support and resistance areas.
Customization options:
Enable/disable lines, arrows, and areas
Adjust colors for all elements
Arrow size (tiny, small, normal, large)
Choose between solid or dashed lines
Alert functions for new Inside and Outs
ide Bars
Use this indicator to more easily identify important candlestick patterns and identify potential trend reversals or continuations early.
-----------------------------------------------------------------
UntouchedIBOB - Indikator für TradingView
Was macht dieser Indikator?
Der UntouchedIBOB-Indikator hilft Ihnen, spezielle Kerzenmuster im Chart zu erkennen: Inside Bars (IB) und Outside Bars (OB). Diese Muster können wichtige Signale für Ihre Trading-Entscheidungen sein.
Die zwei wichtigsten Muster:
Outside Bar (OB) - Eine Kerze, deren Hoch höher und deren Tief tiefer ist als die vorherige Kerze. Sie "umschließt" also die vorherige Kerze vollständig.
Inside Bar (IB) - Eine Kerze, deren Hoch niedriger und deren Tief höher ist als die vorherige Kerze. Sie bewegt sich also komplett "innerhalb" der vorherigen Kerze.
Von Profis getestet und empfohlen:
Wir sind der Hauptlieferant von Trading-Indikatoren für Oliver Klemm , einen der bekanntesten Trader Deutschlands und der gesamten DACH-Region. Unsere Indikatoren werden von erfolgreichen Profi-Tradern täglich im Echtgeld-Handel eingesetzt und kontinuierlich verbessert. Sie profitieren von der gleichen professionellen Technologie, die von führenden Marktexperten genutzt und empfohlen wird.
Hauptfunktionen:
Farbige Kerzen: Inside und Outside Bars werden in verschiedenen Farben dargestellt
Linien: Zeigt horizontale Linien an den Mittelpunkten der IB/OB, die aktiv bleiben bis der Preis sie durchbricht
Pfeile: Optionale Pfeile über/unter den IB/OB für bessere Sichtbarkeit
Alarme: Kann Sie benachrichtigen, wenn neue Inside oder Outside Bars entstehen
Besonderheit:
Der Indikator zeigt nicht nur an, wo sich IB/OBs befinden, sondern verfolgt auch, welche noch "unberührt" sind - das heißt, der Preis hat das Level noch nicht wieder durchbrochen. Dies kann besonders wertvoll sein, da unberührte IB/OB-Levels oft wichtige Unterstützungs- und Widerstandsbereiche darstellen.
Einstellungsmöglichkeiten:
Ein-/Ausschalten von Linien, Pfeilen und Bereichen
Anpassung der Farben für alle Elemente
Wahl zwischen durchgezogenen oder gestrichelten Linien
Alarmfunktionen für neue Inside und Outside Bars
Nutzen Sie diesen Indikator, um wichtige Kerzenmuster leichter zu erkennen und potenzielle Trendwechsel oder Fortsetzungen frühzeitig zu identifizieren.

Price Action Trend and Margin EquityThe Price Action Trend and Margin Equity indicator is a multifunctional market analysis tool that combines elements of money management and price pattern analysis. The indicator helps traders identify key price action patterns and determine optimal entry, exit and stop loss levels based on the current trend.
The main components of the indicator:
Money Management:
Allows the trader to set risk management parameters such as the percentage of possible loss on the position, the use of fixed leverage and the total capital.
Calculates the required leverage level to achieve a specified percentage of loss.
Price Action:
Correctly identifies various price patterns such as Pin Bar, Engulfing Bar, PPR Bar and Inside Bar.
Displays these patterns on the chart with the ability to customize candle colors and display styles.
Allows the trader to customize take profit and stop loss points to display them on the chart.
The ability to display patterns only in the direction of the trend.
Trend: (some code taken from ChartPrime)
Uses a trend cloud to visualize the current market direction.
The trend cloud is displayed on the chart and helps traders determine whether the market is in an uptrend or a downtrend.
Alert:
Allows you to set an alert that will be triggered when the pattern is formed.
Example of use:
Let's say a trader uses the indicator to trade the crypto market. He sets the money management parameters, setting the maximum loss per position to 5% and using a fixed leverage of 1:100. The indicator automatically calculates the required position size to meet these parameters ($: on the label). Or displays the leverage (X: on the label) to achieve the required risk.
The trader receives an alert when a Pin Bar is formed. The indicator displays the entry, exit, and stop loss levels based on this pattern. The trader opens a position for the recommended amount in the direction indicated by the indicator and sets the stop loss and take profit at the recommended levels.
General Settings:
Position Loss Percentage: Sets the maximum loss percentage you are willing to take on a single position.
Use Fixed Leverage: Enables or disables the use of fixed leverage.
Fixed Leverage: Sets the fixed leverage level.
Total Equity: Specifies the total equity you are using for trading. (Required for calculation when using fixed leverage)
Turn Patterns On/Off: You can turn on or off the display of various price patterns such as Pin Bar, Outside Bar (Engulfing), Inside Bar, and PPR Bar.
Pattern Colors: Sets the colors for displaying each pattern on the chart.
Candle Color: Allows you to set a neutral color for candles that do not match the price action.
Show Lines: Allows you to turn on or off the display of labels and lines.
Line Length: Sets the length of the stop, entry, and take profit lines.
Label color: One color for all labels (configured below) or the color of the labels in the color of the candle pattern.
Pin entry: Select the entry point for the pin bar: candle head, bar close, or 50% of the candle.
Coefficients for stop and take lines.
Use trend for price action: When enabled, will show price action signals only in the direction of the trend.
Display trend cloud: Enables or disables the display of the trend cloud.
Cloud calculation period: Sets the period for which the maximum and minimum values for the cloud are calculated. The longer the period, the smoother the cloud will be.
Cloud colors: Sets the colors for uptrends and downtrends, as well as the transparency of the cloud.
The logic of the indicator:
Pin Bar is a candle with a long upper or lower shadow and a short body.
Logic: If the length of one shadow is twice the body and the opposite shadow of the candle, it is considered a Pin Bar.
An Inside Bar is a candle that is completely engulfed by the previous candle.
Logic: If the high and low of the current candle are inside the previous candle, it is an Inside Bar.
An Outside Bar or Engulfing is a candle that completely engulfs the previous candle.
Logic: If the high and low of the current candle are outside the previous candle and close outside the previous candle, it is an Outside Bar.
A PPR Bar is a candle that closes above or below the previous candle.
Logic: If the current candle closes above the high of the previous candle or below its low, it is a PPR Bar.
Stop Loss Levels: Calculated based on the specified ratios. If set to 1.0, it shows the correct stop for the pattern by pushing away from the entry point.
Take Profit Levels: Calculated based on the specified ratios.
Create a Label: The label is created at the stop loss level and contains information about the potential leverage and loss.
The formula for calculating the $ value is:
=(Total Capital x (Maximum Loss Percentage on Position/100)) / (Difference between Entry Level and Stop Loss Level × Ratio that sets the stop loss level relative to the length of the candlestick shadow × Fixed Leverage Value) .
Labels contain the following information:
The percentage of price change from the recommended entry point to the stop loss level.
Required Leverage (X: ): The amount of leverage required to achieve the specified loss percentage. (Or a fixed value if selected).
Required Capital ($: ): The amount of capital required to open a position with the specified leverage and loss percentage (only displayed when using fixed leverage).
The trend cloud identifies the maximum and minimum price values for the specified period.
The cloud value is set depending on whether the current price is equal to the high or low values.
If the current closing price is equal to the high value, the cloud is set at the low value, and vice versa.
RU
Индикатор "Price Action Trend and Margin Equity" представляет собой многофункциональный инструмент для анализа рынка, объединяющий в себе элементы управления капиталом и анализа ценовых паттернов. Индикатор помогает трейдерам идентифицировать ключевые прайс экшн паттерны и определять оптимальные уровни входа, выхода и стоп-лосс на основе текущего тренда.
Основные компоненты индикатора:
Управление капиталом:
Позволяет трейдеру задавать параметры управления рисками, такие как процент возможного убытка по позиции, использование фиксированного плеча и общий капитал.
Рассчитывает необходимый уровень плеча для достижения заданного процента убытка.
Price Action:
Правильно идентифицирует различные ценовые паттерны, такие как Pin Bar, Поглащение Бар, PPR Bar и Внутренний Бар.
Отображает эти паттерны на графике с возможностью настройки цветов свечей и стилей отображения.
Позволяет трейдеру настраивать точки тейк профита и стоп лосса для отображения их на графике.
Возможность отображения паттернов только в натправлении тренда.
Trend: (часть кода взята у ChartPrime)
Использует облако тренда для визуализации текущего направления рынка.
Облако тренда отображается на графике и помогает трейдерам определить, находится ли рынок в восходящем или нисходящем тренде.
Оповещение:
Дает возможность установить оповещение которое будет срабатывать при формировании паттерна.
Пример применения:
Предположим, трейдер использует индикатор для торговли на крипто рынке. Он настраивает параметры управления капиталом, устанавливая максимальный убыток по позиции в 5% и используя фиксированное плечо 1:100. Индикатор автоматически рассчитывает необходимый объем позиции для соблюдения этих параметров ($: на лейбле). Или отображает плечо (Х: на лейбле) для достижения необходимого риска.
Трейдер получает оповещение о формировании Pin Bar. Индикатор отображает уровни входа, выхода и стоп-лосс, основанные на этом паттерне. Трейдер открывает позицию на рекомендуемую сумму в направлении, указанном индикатором, и устанавливает стоп-лосс и тейк-профит на рекомендованных уровнях.
Общие настройки:
Процент убытка по позиции: Устанавливает максимальный процент убытка, который вы готовы понести по одной позиции.
Использовать фиксированное плечо: Включает или отключает использование фиксированного плеча.
Уровень фиксированного плеча: Задает уровень фиксированного плеча.
Общий капитал: Указывает общий капитал, который вы используете для торговли. (Необходим для расчета при использовании фиксированного плеча)
Включение/отключение паттернов: Вы можете включить или отключить отображение различных ценовых паттернов, таких как Pin Bar, Outside Bar (Поглощение), Inside Bar и PPR Bar.
Цвета паттернов: Задает цвета для отображения каждого паттерна на графике.
Цвет свечей: Позволяет задать нейтральный цвет для свечей неподходящих под прйс экшн.
Показывать линии: Позволяет включить или отключить отображение лейблов и линий.
Длинна линий: Настройка длинны линий стопа, линии входа и тейк профита.
Цвет лейбла: Один цвет для всех лейблов (настраивается ниже) или цвет лейблов в цвет паттерна свечи.
Вход в пин: Выбор точки входа для пин бара: голова свечи, точка закрытия бара или 50% свечи.
Коэффиценты для стоп и тейк линий.
Использовать тренд для прайс экшна: При включении будет показывать прайс экшн сигналы только в направлении тренда.
Отображение облака тренда: Включает или отключает отображение облака тренда.
Период расчета облака: Устанавливает период, за который рассчитываются максимальные и минимальные значения для облака. Чем больше период, тем более сглаженным будет облако.
Цвета облака: Задает цвета для восходящего и нисходящего трендов, а также прозрачность облака.
Логика работы индикатора:
Pin Bar — это свеча с длинной верхней или нижней тенью и коротким телом.
Логика: Если длина одной тени вдвое больше тела и противоположной тени свечи, считается, что это Pin Bar.
Inside Bar — это свеча, полностью поглощенная предыдущей свечой.
Логика: Если максимум и минимум текущей свечи находятся внутри предыдущей свечи, это Inside Bar.
Outside Bar или Поглощение — это свеча, которая полностью поглощает предыдущую свечу.
Логика: Если максимум и минимум текущей свечи выходят за пределы предыдущей свечи и закрывается за пределами предыдущей свечи, это Outside Bar.
PPR Bar — это свеча, которая закрывается выше или ниже предыдущей свечи.
Логика: Если текущая свеча закрывается выше максимума предыдущей свечи или ниже ее минимума, это PPR Bar.
Уровни стоп-лосс: Рассчитываются на основе заданных коэффициентов. При значении 1.0 показывает правильный стоп для паттерна отталкиваясь от точки входа.
Уровки тейк-профита: Рассчитываются на основе заданных коэффициентов.
Создание метки: Метка создается на уровне стоп-лосс и содержит информацию о потенциальном плече и убытке.
Формула для вычисления значения $:
=(Общий капитал x (Максимальный процент убытка по позиции/100)) / (Разница между уровнем входа и уровнем стоп-лосс × Коэффициент, задающий уровень стоп-лосс относительно длины тени свечи × Значение фиксированного плеча).
Метки содержат следующую информацию:
Процент изменения цены от рекомендованной точки входа до уровня стоп-лосс.
Необходимое плечо (Х: ): Уровень плеча, необходимый для достижения заданного процента убытка. (Или фиксированное значение если оно выбрано).
Необходимый капитал ($: ): Сумма капитала, необходимая для открытия позиции с заданным плечом и процентом убытка (отображается только при использовании фиксированного плеча).
Облако тренда определяет максимальные и минимальные значения цены за указанный период.
Значение облака устанавливается в зависимости от того, совпадает ли текущая цена с максимальными или минимальными значениями.
Если текущая цена закрытия равна максимальному значению, облако устанавливается на уровне минимального значения, и наоборот.

CandleStick [TradingFinder] - All Reversal & Trend Patterns🔵 Introduction
"Candlesticks" patterns are used to predict price movements. We have included 5 of the best candlestick patterns that are common and very useful in "technical analysis" in this script to identify them automatically. The most important advantage of this indicator for users is saving time and high precision in identifying patterns.
These patterns are "Pin Bar," "Dark Cloud," "Piercing Line," "3 Inside Bar," and "Engulfing." By using these patterns, you can predict price movements more accurately and therefore make better decisions in your trades.
🔵 How to Use
Pin Bar : This pattern consists of a Candle where "Open Price," "Close Price," "High Price," and "Low Price" form the "Candle Body," and it also has "Long Shadow" and "Short Shadow." In the visual appearance of the Pin Bar pattern, we have a candle body and a pin bar shadow, where the candle body is smaller relative to the shadow.
Just as the candle body plays an important role in analysis, the pin bar shadow can also be influential. The larger the pin bar shadow, the stronger the expectation of a trend reversal.
When a "bearish pin bar" occurs at resistance or the chart ceiling, it can be predicted that the price trend will be downward. Similarly, at support points and the chart floor, a "bullish pin bar" can indicate an upward price movement.
Additionally, patterns like "Hammer," "Shooting Star," "Hanging Man," and "Inverted Hammer" are types of pin bars. Pin bars are formed in two ways: bullish pin bars have a long lower shadow, and bearish pin bars have a long upper shadow. Important: Displaying "Bullish Pin Bar" is labeled "BuPB," and "Bearish Pin Bar" is labeled "BePB."
Dark Cloud : The Dark Cloud pattern is one type of two-candle patterns that occurs at the end of an uptrend. The 2-candle pattern indicates the shape of this pattern, which actually consists of 2 candles, one bullish and one bearish. This pattern indicates a trend reversal and is quite powerful.
The Dark Cloud pattern is seen when, after a bullish candle at the end of an uptrend, a bearish candle opens at a higher level (weakly, equal, or higher) than the closing point of the bullish candle and finally closes at a point approximately in the middle of the previous candle. In this indicator, the Dark Cloud pattern is identified as "Wick" and "Strong" .
The difference between these two lies in the strictness of their conditions. Important: Strong Dark Cloud is labeled "SDC," and Weak Dark Cloud is labeled "WDC."
Piercing Line : The Piercing candlestick pattern consists of 2 candles, the first being bearish and consistent with the previous trend, and the second being bullish. The conditions of the pattern are such that the first candle is bearish and a price gap is created between the two candles upon the opening of the next candle because its opening price is below (weakly equal to or less than) the closing price of the previous candle.
Additionally, its closing price must be at least 50% above the red candle.
This means that the second candle must penetrate at least 50% into the first candle. Important: Strong Piercing Line is labeled "SPL," and Weak Piercing Line is labeled "WPL."
3 Inside Bar (3 Bar Reversal) : The 3 Inside Bar pattern is a reversal pattern. This pattern consists of 3 consecutive candles and can be either bullish or bearish. In the bullish pattern (Inside Up) formed at the end of a downtrend, the last candle must be bullish, and the third candle from the end must be bearish.
Additionally, the close price must be more than 50% of the third candle from the end. In the bearish pattern (Inside Down) formed at the end of an uptrend, the last candle must be bearish, and the third candle from the end must be bullish. Additionally, the close price must be less than 50% of the third candle from the end. Important: Bullish 3 Inside Bar is labeled "Bu3IB," and Bearish 3 Inside Bar is labeled "Be3IB."
Engulfing : The Engulfing candlestick pattern is a reversal pattern and consists of at least two candles, where one of them completely engulfs the body of the previous or following candle due to high volatility.
For this reason, the term "engulfing" is used for this pattern. This pattern occurs when the price body of a candle encompasses one or more candles before it. Engulfing candles can be bullish or bearish. Bullish Engulfing forms as a reversal candle at the end of a downtrend.
Bullish Engulfing indicates strong buying power and signals the beginning of an uptrend. This pattern is a bullish candle with a long upward body that completely covers the downward body before it. Bearish Engulfing, as a reversal pattern, is a long bearish candle that engulfs the upward candle before it.
Bearish Engulfing forms at the end of an uptrend and indicates the pressure of new sellers and their strong power. Additionally, forming this pattern at resistance levels and the absence of a lower shadow increases its credibility. Important: Bullish Engulfing is labeled "BuE," and Bearish Engulfing is labeled "BeE."
🔵 Settings
This section, you can use the buttons "Show Pin Bar," "Show Dark Cloud," "Show Piercing Line," "Show 3 Inside Bar," and "Show Engulfing" to enable or disable the display of each of these candlestick patterns.

UDIO BarsUp-Down-Inside-Outside Bars
I prefer to see bars in a simpler fashion that is more logical.
An UP BAR is a bar when the market makes a high that is higher AND when the low is higher than the bar before.
A DOWN BAR is when the market makes a lower low AND a lower high.
The UP or DOWN BAR is not based on the close-to-close movement which is also called NET CHANGE for the bar AND it also disregards the open-close movement as well, which can be misleading more often than not.
This allows you to easily see periods of INDECISION when the bars are painted black because if the bar isn't RED or GREEN, it will be painted black.
INSIDE bars and OUTSIDE bars are INDECISION days.
INSIDE BARS: The market wants to wait for news or has exhausted itself on an INSIDE bar. The market makes neither a higher high or a lower low. Instead, the market trades in a tighter range inside the high and low of the bar before. Hence the name "inside bar".
OUTSIDE BARS: The market exhausts one side of the market after a new high or new low, then reverses and stops out anyone outside the range of the bar prior. Essentially, neither side of the market is strong on an OUTSIDE bar. Outside bars can cause sharp losses for trend traders and if you see many of them near each other, the market is preparing itself for a large move one way or the other.
UDIO = Up Down Inside Outside and I think it is a tool you all will want to use to make your charts tell a story and alert you to important price levels.
After a long trend of green and red bars, you may find that there are many black bars starting to appear and that can be a sign the trend is ending and is ready to reverse.

5-Minute YEN Pivot Bars 1.0The 5-Minute YEN Pivot Bars indicator is designed to identify and highlight low-range pivot bars on 5-minute charts, specifically tailored for Yen-based pairs (e.g., GBPJPY, USDJPY). By focusing on precise pip thresholds, this tool helps traders detect potential pivot points within specific trading sessions, while avoiding inside bars and other noise often seen in low-volatility conditions. This can be particularly useful for trend traders and those looking to refine their entry points based on intraday reversals.
Key Features:
- Customized Pip Thresholds for Yen Pairs:
The indicator is pre-configured for Yen pairs, where 1 pip is typically represented by 0.01. It applies these thresholds:
- Limited Range: 4 pips or less between open and close prices.
- High/Low Directionality: At least 3 pips from the close/open to the bar's high or low.
- Open/Close Proximity: 4 pips or less between open and close.
- Inside Bar Tolerance: A tolerance of 3 pips for inside bars, helping reduce false signals from bars contained within the previous bar's range.
- Session-Specific Alerts:
- The indicator allows you to enable alerts for the European Session (6:00-12:00), American Session (12:00-17:00), and London Close (17:00-20:00). You can adjust these times based on your own trading hours or timezone preferences via a time-shift setting.
- Receive real-time alerts when a valid bullish or bearish pivot bar is identified within the chosen sessions, allowing you to respond to potential trade opportunities immediately.
- Time Shift Customization:
- Adjust the "Time Shift" parameter to account for different time zones, ensuring accurate session alignment regardless of your local time.
How It Works:
1. Pivot Bar Identification:
The indicator scans for bars where the difference between the open and close is within the "Limited Range" threshold, and both open and close prices are close to either the high or the low of the bar.
2. Directional Filtering:
It requires the bar to show strong directional bias by enforcing an additional distance between the open/close levels and the opposite end of the bar (high/low). Only bars with this directional structure are considered for highlighting.
3. Exclusion of Inside Bars:
Bars that are completely contained within the range of the previous bar are excluded (inside bars), as are consecutive inside bars. This filtering is essential to avoid marking bars that typically indicate consolidation rather than potential pivot points.
4. Session Alerts:
When a valid pivot bar appears within the selected sessions, an alert is triggered, notifying the trader of a potential trading signal. Bullish and bearish signals are differentiated based on whether the close is near the high or low.
How to Use:
- Trend Reversals: Use this indicator to spot potential trend reversals or pullbacks on a 5-minute chart, especially within key trading sessions.
- Entry and Exit Points: Highlighted bars can serve as potential entry points for traders looking to capitalize on short-term directional changes or continuation patterns.
- Combine with Other Indicators: Consider pairing this tool with momentum indicators or trendlines to confirm the signals, providing a comprehensive analysis framework.
Default Parameters:
- Limited Range: 4 Pips
- High/Low Directionality: 3 Pips
- Open/Close Proximity: 4 Pips
- Inside Bar Tolerance: 3 Pips
- Session Alerts: Enabled for European, American, and London Close sessions
- Time Shift: Default 6 (adjustable to align with different time zones)
This indicator is specifically optimized for Yen pairs on 5-minute charts due to its pip calculation.

Fractal WavesSummary of the "Fractal Waves" Indicator
The "Fractal Waves" indicator is a multifaceted trading tool designed for TradingView that combines various technical analysis methods to help traders identify potential market trends and trading opportunities. It overlays multiple analyses directly onto price charts, providing a comprehensive visual representation of market dynamics.
Key Features:
Fractal Wave Detection and Visualization:
Purpose: Identifies fractal highs and lows to signal potential trend reversals or continuations.
Functionality: Calculates fractal highs, lows, and midpoints on both the current and an additional user-selected timeframe. Plots lines at these fractal points with color coding to distinguish between bullish and bearish trends. Fills areas between fractal highs and lows with background colors to enhance visual cues. Updates fractal lines dynamically as new fractals are identified. Multiple Time Frame Moving Averages (MTF MA):
Purpose: Provides insight into trend directions across different timeframes.
Functionality: Allows plotting of up to three customizable moving averages from different timeframes on the current chart. Users can select the type of MA (SMA, EMA, DEMA, VWMA, RMA, WMA), length, resolution, and color. Optionally displays labels showing MA details like type, length, and resolution for clarity. Bar Pattern Identification (Inside and Outside Bars):
Purpose: Highlights specific bar patterns that may indicate market indecision or breakout potential.
Functionality: Detects inside bars (where the current bar's range is within the previous bar) and outside bars (where the current bar's range exceeds the previous bar). Colors bars based on whether they are bullish or bearish inside/outside bars using user-defined colors. Utilizes "The Strat" methodology to assign numbers (1 for inside bars, 2 for directional bars, 3 for outside bars) and plots them above the bars. Wicked Wicks Visualization:
Purpose: Highlights significant wicks that may indicate rejection at certain price levels.
Functionality: Identifies long upper wicks (top wicks) and lower wicks (bottom wicks) relative to previous bars. Plots custom candles to emphasize these wicks with specific background and border colors. Aids in recognizing potential reversals or strong buying/selling pressure. Volume Weighted Average Price (VWAP):
Purpose: Helps identify the average trading price weighted by volume, acting as dynamic support or resistance.
Functionality: Calculates and plots the daily VWAP, updating at the start of each session. Changes VWAP line color at session start for visual differentiation. Applicable primarily to intraday charts (60-minute timeframe or lower). Volume and Extreme Volume Reversal (EVR) Analysis:
Purpose: Detects areas of unusually high volume that may precede price reversals.
Functionality: Tracks the highest volume bars of the current and previous day. Plots boxes and lines to highlight extreme volume areas. Changes candle colors for high-volume bars to draw attention. Calculates and plots potential reversal levels based on extreme volume. Rate of Change (ROC) and Average True Range (ATR) Ratio Analysis:
Purpose: Assesses price momentum relative to volatility to predict trend changes.
Functionality: Calculates the ROC and ATR over specified lengths. Computes the ratio of ROC to ATR to gauge momentum. Plots bullish or bearish dots on the chart when ROC-ATR ratio aligns with the fractal trend, indicating potential trend shifts. Provides alerts when a new bullish or bearish trend is detected. Average Volume Weighted Average Price (AVWAP) with Dynamic Lookback Periods:
Purpose: Identifies key price levels based on volume-weighted averages over specific lookback periods.
Functionality: Calculates AVWAPs from the highest and lowest points over dynamic or manual lookback periods. Adjusts lookback periods automatically based on the current chart timeframe or uses user-defined periods. Plots AVWAP lines and fills the area between them, highlighting overlaps which may signify significant support/resistance levels. Fractal Wave Table Across Multiple Timeframes:
Purpose: Provides a quick overview of fractal trends and inside bar patterns across various timeframes.
Functionality: Displays a table at the bottom of the chart showing fractal wave values and inside bar statuses for timeframes from 5 minutes to monthly. Uses color coding to indicate bullish or bearish trends and whether the price is above or below the fractal wave. Indicates inside bars with symbols and colors to quickly identify consolidation periods. Alert Conditions:
Purpose: Keeps traders informed of significant market events without constant monitoring.
Functionality: Triggers alerts for: Bullish or bearish trend changes when the ROC-ATR ratio aligns with the fractal trend. Price crossing above a fractal high or below a fractal low. Formation of new bullish or bearish fractals. EVR-based potential long or short opportunities.
Usage Notes:
Customization: The indicator offers extensive customization options, allowing users to adjust colors, timeframes, calculation periods, and display preferences to suit their trading style. Timeframe Considerations: Some features, like EVR analysis and intraday VWAP, are optimized for intraday timeframes (up to 60 minutes). The indicator adjusts calculations and visualizations based on the current chart's timeframe. Comprehensive Analysis: By combining multiple technical analysis tools—such as fractals, moving averages, volume analysis, and bar patterns—the indicator provides a holistic view of market conditions. Visual Clarity: The use of color coding, labels, and symbols enhances visual interpretation, making it easier for traders to identify patterns and trends at a glance. Alerts and Notifications: Built-in alert conditions help traders stay informed of key market developments, enabling timely decision-making without the need for constant chart monitoring.
Conclusion:
The "Fractal Waves" indicator serves as an advanced analytical tool that synthesizes various technical indicators to support traders in market analysis. By overlaying fractal patterns, moving averages from multiple timeframes, volume analysis, and bar patterns onto price charts, it aids in identifying potential trading opportunities and understanding market dynamics across different timeframes. The combination of visual cues and alert notifications makes it a valuable asset for traders seeking deeper insight into market behavior.
Simple STRAT Tool by nnamWhat this Indicator Does
This indicator is a very simple tool created specifically for experienced Straters. It was created for those Straters who fully understand the 1-2-3 Strat Scenarios, are in need of an easy to use tool, and do not want or need a lot of messy markings on their chart.
The indicator simply allows the user to color code the Strat 1, 2 ,3 (Inside /Outside /Up / Down) Bars as desired and by default extends lines to the right of the chart from the Highs and Lows of the previous 2 Bars giving the user a simple reference for Strat scenario structure breaks.
As shown above, the bars are color coded, but the original bar color is maintained via the border and wick.
If a bar is an Outside Bar or an Inside Bar, it is still easy to identify whether or not the bar was a Bullish or Bearish 1 or 3.
The same goes for 2UP and 2Down Bars - It is easy to identify Bullish or Bearish UP or DOWN Bars.
Optionally, as show in the screenshot below, the user can extend the lines in both directions to get an "at a glance" better understanding of where price is currently vs previous support and resistance areas.
For Straters that prefer to trade only INSIDE BAR BREAKOUTS there is an optional input setting labeled "Trade Inside Bars ONLY".
This setting turns OFF the lines that extend from the 2nd previous bar back and only displays and extend lines from the previous bar IF and ONLY IF the current bar is an INSIDE (one) bar. .
The User Input settings allow for the following customizations:
1. Custom Outside Bar Color
2. Custom Inside Bar Color
3. Custom 2 Up Bar Color
4. Custom 2 Down Bar Color
5. Turn ON or OFF color coded bars
6. Trade only INSIDE Bar Breakouts
7. Extend Lines Both Directions
8. Hide all Lines
The customizable settings above allow the user to hide all lines and turn OFF color coding without having to fully remove the indicator from the chart. This is convenient when the user has another indicator that uses color coded bars or the lines conflict with another indicator and they need to be temporarily disabled.
If you have any questions regarding this indicator please let me know. If you have any suggestions for minor tweaks to the indicator do not hesitate to ask for them.
I hope you enjoy this indicator and get some usefulness from it... HAPPY TRADING!!
NY 4H Wyckoff State Machine [CHE] NY 4H Wyckoff State Machine — Full (Re-Entry, Breakout, Wick, Re-Accum/Distrib, Dynamic Table) — One-Candle Wyckoff Re-Entry (OCWR)
Summary
OCWR operationalizes a one-candle session workflow: mark the first four-hour New York candle, fix its high and low as the session range when the window closes, and drive entries through a Wyckoff-style state machine on intraday bars. The script adds an ATR-scaled buffer around the range and requires multi-bar acceptance before treating breaks or re-entries as valid. Optional wick-cluster evidence, a proximity retest, and simple volume or RSI gates increase selectivity. Background tints expose regimes, shapes mark events, a dynamic table explains the current state, and hidden plots supply alert payloads. The design reduces random flips and makes state transitions auditable without higher-timeframe calls.
Origin and name
Method name: One-Candle Wyckoff Re-Entry (OCWR)
Transcript origin: The source idea is a “stupid simple one-candle scalping” routine: mark the first New York four-hour candle (commonly between one and five in the morning New York time), drop to five minutes, observe accumulation inside, wait for a manipulation move outside, then trade the re-entry back inside. Stops go beyond the excursion extreme; targets are either a fixed reward multiple or the opposite side of the range. Preference is given to several manipulation candles. This indicator codifies that workflow with explicit states, acceptance counters, buffers, and optional quality filters. Any external performance claims are not part of the code.
Motivation: Why this design?
Session levels are widely respected, yet single-bar breaches around them are noisy. OCWR separates range discovery from trade logic. It locks the range at the end of the window, applies an ATR-scaled buffer to ignore marginal oversteps, and requires acceptance over several bars for breaks and re-entries. Wick evidence and optional retest proximity help confirm that an excursion likely cleared liquidity rather than launched a trend. This yields cleaner transitions from test to commitment.
What’s different vs. standard approaches?
Baseline: Static session lines or one-shot Wyckoff tags without process control.
Architecture: Dual long and short state machines; ATR-buffered edges; multi-bar acceptance for breaks and re-entries; optional wick dominance and cluster checks; optional retest tolerance; direct and opposite breakout paths; cooldown after fires; distribution timeout; dynamic table with highlighted row.
Practical effect: Fewer single-bar head-fakes, clearer hand-offs, and on-chart explanations of the machine’s view.
Wyckoff structure by example — OCWR on five minutes
One-candle setup:
On the four-hour chart, mark the first New York candle’s high and low, then switch to five minutes. Solid lines show the fixed range; dashed lines show ATR-buffered edges.
Long path (verbal mapping):
Phase A, Stopping Action: Price stabilizes inside the range.
Phase B, Consolidation: Sustained balance while the window is closed and after the range is fixed.
Phase C, Test (Spring): Excursion below the buffered low with preference for several outside bars and dominant lower wicks, then a return inside.
Re-entry acceptance: A required run of inside bars validates the test.
Phase D, Breakout to Markup: Long signal fires; stop beyond the excursion extreme; objective is the opposite range or a fixed reward multiple.
Phase E, Trend (Markup) and Re-Accumulation: Advance continues until target, stop, confirmation back against the box, or timeout. A pause inside trend may register as re-accumulation.
Short path mirrors the above: A UTAD-style move forms above the buffered high, then re-entry leads to Markdown and possible re-distribution.
Variant map (verbal):
Accumulation after a downtrend: with Spring and Test, or without Spring; both proceed to Markup and may pause in Re-Accumulation.
Distribution after an uptrend: with UTAD and Test, or without UTAD; both proceed to Markdown and may pause in Re-Distribution.
Note: Phases A through E occur within each variant and are not separate variants.
How it works (technical)
Session window: A configurable four-hour New York window records its high and low. At window end, the bounds are fixed for the session.
ATR buffer: A margin above and below the fixed range discourages triggers from tiny oversteps.
Inside and outside: Users choose close-based or wick-based detection. Overshoot requirements are expressed verbally as a fraction of the range with an optional absolute minimum.
Manipulation tracking: The machine counts bars spent outside and records the side extreme.
Re-entry acceptance: After a return inside, a specified number of inside bars must print before acceptance.
Direct and opposite breakouts: Direct breakouts from accumulation and opposite breakouts after manipulation are supported, subject to acceptance and optional filters.
Targets and exits: Choose the opposite boundary or a fixed reward multiple. Distribution ends on target, stop, confirmation back against the range, or timeout.
Context filters (optional): Volume above a scaled SMA, RSI thresholds, and a trend SMA for simple regime context.
Diagnostics: Background tints for regimes; arrows for re-entries; triangles for breakouts; table with row highlights; hidden plots for alert values.
Central table (Wyckoff console)
The table sits top-right and explains the machine’s stance. Columns: Structure label, plain-English description, active state pair for long and short, and human phase tags. Rows: Start and range building; accumulation branch with Spring and Test as well as direct breakout; Markup and re-accumulation; distribution branch with UTAD and Test as well as direct short breakout; Markdown and re-distribution. Only the active state cell is rewritten each last bar, for example “L_ACCUM slash S_ACCUM”. Row highlighting is context-aware: accumulation, Spring or UTAD, breakout, Markup or Markdown, and re-accumulation or re-distribution checks can highlight independently so users see simultaneous conditions. The table is created once, updated only on the last bar for efficiency, and functions as a read-only console to audit why a signal fired and where the path currently sits.
Parameter Guide
Session window and time zone: First four hours of New York by default; time zone “America/New_York”.
ATR length and buffer factor: Control buffer size; larger reduces sensitivity, smaller reacts faster.
Minimum overshoot (fraction and absolute): Demand meaningful extension beyond the buffer.
Break mode: Close-based is stricter; wick-based is more reactive.
Acceptance counts: Separate counts for break, re-entry, and opposite breakout; higher values reduce noise.
Minimum bars outside: Ensures manipulation is not a single spike.
Wick detection and clusters (optional): Dominance thresholds and cluster size within a short window.
Retest required and tolerance (optional): Gate re-entry by proximity to the buffered edge.
Volume and RSI filters (optional): Simple gates on activity and momentum.
TP mode and reward multiple: Opposite range or fixed multiple.
Cooldown and distribution timeout: Rate-limit signals and prevent endless distribution.
Visualization toggles: Background phases, labels, table, and helper lines.
Reading & Interpretation
Solid lines are the fixed session bounds; dashed lines are buffers. Backgrounds tint accumulation, manipulation, and distribution. Arrows show accepted re-entries; triangles show direct or opposite breakouts. Labels can summarize entry, stop, target, and risk. The table highlights the active row and the current state pair.
Practical Workflows & Combinations
OCWR baseline: Each morning, mark the New York four-hour candle, move to five minutes, prefer multi-bar manipulation outside, then wait for a qualified re-entry inside. Stop beyond the excursion extreme. Target the opposite range for conservative management or a fixed multiple for uniform sizing.
Trend following: Favor direct breakouts with trend alignment and no contradictory wick evidence.
Quality control: When noise rises, increase acceptance, raise the buffer factor, enable retest, and require wick clusters.
Discretionary confluences: Fair-value gaps and trend lines can be added by the user; they are not computed by this script.
Behavior, Constraints & Performance
Closed-bar confirmation is recommended when you require finality; live-bar conditions can change until close. The script does not call higher-timeframe data. It uses arrays, lines, labels, boxes, and a table; maximum bars back is five thousand; table updates are last-bar only. Known limits include compressed buffers in quiet sessions, unreliable wick evidence in thin markets, and session misalignment if the platform time zone is not New York.
Sensible Defaults & Quick Tuning
Start with ATR length fourteen, buffer factor near zero point fifteen, overshoot fraction near zero point ten, acceptance counts of two, minimum outside duration three, retest required on.
Too many flips: increase acceptance, raise buffer, enable retest, and tighten wick thresholds.
Too slow: reduce acceptance, lower buffer, switch to wick-based breaks, disable retest.
Noisy wicks: increase minimum wick ratio and cluster size, or disable wick detection.
What this indicator is—and isn’t
A session-anchored visualization and signal layer that formalizes a Wyckoff-style re-entry and breakout workflow derived from a single four-hour New York candle. It is not predictive and not a complete trading system. Use with structure analysis, risk controls, and position management.
Disclaimer
The content provided, including all code and materials, is strictly for educational and informational purposes only. It is not intended as, and should not be interpreted as, financial advice, a recommendation to buy or sell any financial instrument, or an offer of any financial product or service. All strategies, tools, and examples discussed are provided for illustrative purposes to demonstrate coding techniques and the functionality of Pine Script within a trading context.
Any results from strategies or tools provided are hypothetical, and past performance is not indicative of future results. Trading and investing involve high risk, including the potential loss of principal, and may not be suitable for all individuals. Before making any trading decisions, please consult with a qualified financial professional to understand the risks involved.
By using this script, you acknowledge and agree that any trading decisions are made solely at your discretion and risk.
Do not use this indicator on Heikin-Ashi, Renko, Kagi, Point-and-Figure, or Range charts, as these chart types can produce unrealistic results for signal markers and alerts.
Best regards and happy trading
Chervolino

AriVestHub_SMCIntroduction to the AriVestHub_SMC Indicator
The AriVestHub_SMC indicator is designed and coded based on Smart Money Concepts (SMC). This tool has unique features that you won’t find in any other indicator built around SMC.
I’ve been active in the crypto market since 2019, and besides using the SMC strategy, I also apply several custom strategies in my trading. Personalized versions of these strategies will gradually be shared with you as well.
The main reason for developing this indicator was the gap in existing tools. Many times, setups like Valid Pullback or Inside Bar Candles appear on the chart but are not easily recognizable at first glance, and therefore they get ignored. This often leads to mistakes in Market Structure Mapping right from the beginning, which then causes errors in further analysis and predictions.
Since the SMC strategy is entirely built on market structure, any mistake in identifying its key components basically destroys the reliability of the analysis.
Unlike similar indicators that mostly just draw nice lines and zones on the chart for promotional purposes, AriVestHub_SMC aims to show the reality of the market, not beautify it. Price behavior is the result of trader psychology and the clash of different views—it doesn’t have to look neat and pretty all the time.
This indicator shows exactly what has happened in the market and the possible scenarios ahead. Once you use this tool and study this guide, you’ll clearly feel the difference compared to other common indicators. My main goal in creating AriVestHub_SMC was to give real help to traders—not just to sell or commercialize it.
The AriVestHub_SMC indicator is basically a Market Structure Mapping Engine (SMC Structure Mapping Engine), whose main task is to detect and accurately map market structure movements.
The market is full of exceptional conditions, and analyzing them without indicators and only by visual inspection is almost impossible. This often leads to errors, especially in strategies that are based on market structure.
One of the most important and valuable features of this indicator compared to similar ones is that, after extensively studying and manually analyzing various charts with indicators, I have coded almost all common scenarios as well as exceptional cases that occur under different market conditions.
________________________________________
Its key features include:
• BOS / CHoCH – Detecting
• breakouts and changes in market character
• IDM / Pullback – Confirming pivots and valid moves
• OF / OB – Marking key supply and demand zones
• SMT (Smart Money Trap) – Spotting invalid zones and smart money traps
• Liquidity Sweeps / Equal High-Low – Liquidity hunts and reversal setups
• Transfer Option – Automatically correcting structure in Single Leg scenarios
________________________________________
Basic Concepts in the AriVestHub_SMC Strategy
1. Inside Bar
An Inside Bar is a candle (or group of candles) whose price range falls between the High and Low of the previous candle.
In Smart Money and market structure analysis, these candles are usually ignored, and only the main candle is considered.
Simply put, an Inside Bar signals market pause and energy buildup—a place where both buyers and sellers are waiting for price to decide its next direction.
In the picture, you can see candles highlighted in a different color that fall within the main candle range. They should not be treated as independent candles, and all of them together should be considered as one.
________________________________________
2. Pullback
A pullback happens when price makes a temporary return after a main move. Even a single candle can cause it.
In Smart Money, a valid pullback is defined as:
• In an uptrend: if the Low of a candle breaks the Low of the previous candle which is not an Inside Bar, a valid pullback occurs.
• In a downtrend: if the High of a candle breaks the High of the previous candle which is not an Inside Bar, a valid pullback occurs.
Valid pullbacks are the points where the market gathers the energy needed to continue its move.
In the image below, both valid and invalid pullbacks are shown.
________________________________________
3. IDM – Inducement
Inducement is one of the most important concepts in AriVestHub_SMC. Without IDM, no structure in Smart Money can form.
Every valid pullback can be considered an IDM.
There are two types: Major IDM and Minor IDM.
Correctly identifying IDM is critical, because the entire market structure is mapped based on it.
After each BOS or CHoCH, a new HH or LL pivot is only confirmed if the price returns and touches the IDM.
• In an uptrend after BOS: the lowest price of the first valid pullback is the Major IDM, and the last pullback before reaching the Major IDM is the Minor IDM.
• In an uptrend after CHoCH: the highest price of the first valid pullback is the Major IDM, and the last pullback before reaching the Major IDM is the Minor IDM.
The same rules apply in reverse for downtrends.
In this strategy, Major IDM always takes priority.
The image shows different types of IDM, and the same applies for downtrends.
________________________________________
4. BOS – Break of Structure
A Break of Structure happens when price breaks its previous High or Low in the direction of the trend:
• In an uptrend: if the previous HH is broken, BOS occurs.
• In a downtrend: if the previous LL is broken, BOS occurs.
BOS confirms continuation of the current market trend.
________________________________________
5. CHoCH – Change of Character
Change of Character occurs when price moves against the previous trend:
• In an uptrend: if the previous LL is broken, CHoCH occurs.
• In a downtrend: if the previous HH is broken, CHoCH occurs.
CHoCH is usually a signal of a trend reversal or a deep market correction.
The image shows the overall market structure with BOS and CHoCH.
________________________________________
6. Order Flow
Order Flow zones are formed from valid pullbacks and are usually points where price reacts strongly.
They are defined as:
• In an uptrend: Last Selling Momentum Before pushing upside
• In a downtrend: Last Buying Momentum Before pushing dowside
Three main types of Order Flow used in this strategy:
• OF: Decisional (Dec) – The first valid OF after IDM, where the market makes its key decision.
• OF: Extreme (Ext) – The last valid OF after IDM, acting as the final defense of buyers or sellers.
• SMT – Smart Money Trap – All order zones before IDM, and those between Dec and Ext. These usually cause short-term, deceptive reactions and are not valid for trading.
In addition:
• Unmitigated Order Flow – A zone not yet touched, still a liquidity source.
• Mitigated Order Flow – A zone that has been touched, with reduced validity.
• Redefine Order Flow – Identifying internal OFs within a main unmitigated OF for more precise entries.
The image shows the different types of OF.
________________________________________
7. H/L Liquidity Sweep
A Liquidity Sweep happens when price breaks a previous High or Low with a wick, but the candle body fails to close beyond it.
• If the High is broken with a wick but the candle closes below it, a Liquidity Sweep occurs.
• If the Low is broken with a wick but the candle closes above it, a Liquidity Sweep occurs.
These setups are often signs of trapping traders and starting a move in the opposite direction. In fact, Liquidity Sweep points are among the best trading setups.
________________________________________
🔑 Final Note
All these concepts are like puzzle pieces: Inside Bar, Valid Pullback, IDM, BOS, CHoCH, Order Flow, and Liquidity Sweep.
When combined, they create a clear and accurate picture of the market’s real behavior.
________________________________________
Indicator Settings
1. Analyze From … To …
• Set the analysis time range.
• Another use: In ping-pong structures, you can add another copy of the indicator to the chart, set the starting point at the recent HH or LL, and map the internal structure for counter-trend trading.
________________________________________
2. Main
• Confirm CHoCH with wicks → If enabled, only the wick (not the body) is considered for BOS and CHoCH confirmation. Useful for spotting subtle liquidity-based breaks.
• Major / Minor IDM → Choose IDM type.
• Consider Inside Bar → Best kept enabled, so candles inside the previous candle are ignored.
________________________________________
3. Fib Ret
• Min pullback retracement % → Set the minimum retracement level.
• Helps identify valid pullbacks and gives more confidence in trend continuation.
• Meaning: if BOS happens, price must at least retrace by the minimum percentage before expecting the trend to continue.
________________________________________
4. BOS/CHoCH
• Display BOS and CHoCH on the chart with customizable color and style.
________________________________________
5. IDM
• Mark previous IDM : Show past IDMs.
• Mark live IDM : Show current active IDM.
• Customize IDM display options.
________________________________________
6. Pivots
• Display HH and LL pivots.
________________________________________
7. Transferring H/L IDM BOS/CHoCH
• Transfer in case of lack idmB or idmS → When the move is Single Leg and no valid IDM exists in the recent move, HH, LL, and IDM must be shifted and corrected. This adjusts the market structure.
• In case of transferring, remove all previous transferred Market Structure → If enabled, every time HH/LL and IDM need to be shifted, the transfer happens and the market structure is re-analyzed from scratch.
• Important: Often after one transfer, another Single Leg appears. This option keeps adjusting structure automatically, while doing it manually would be slow and error-prone.
________________________________________
8. Order Flow
• Display Decisional, Extreme, and Supply/Demand OFs.
________________________________________
9. H/L Sweeps
• Detect Liquidity Sweeps at Highs and Lows.
• These are very strong reversal setups.
________________________________________
10. Equal High/Low
• Show equal Highs and Lows where liquidity often accumulates.
________________________________________
11. Moving Average
• Add a moving average as a trend filter.
• Option to choose type (SMA/EMA) and length (e.g., 50 or 200).
• Usually:
o MA50 → For mid-term trends, quick confirmation.
o MA200 → For long-term trends, stronger confirmation.
________________________________________
12. Internal Structure (ZigZag)
• Show internal market structure as ZigZag.
________________________________________
13. Inside Bar Candles
• Display Inside Bars in color or with a box.

Candle PA Scanner (Engulfing / Inside / Pin) by BK SahniHere’s how to read the “Candle PA Scanner (Engulfing / Inside / Pin)” and what each input means.
What the signals look like on your chart
B-ENG (label above/below bar)
Bullish Engulfing → “B-ENG” below the bar (green/teal).
Bearish Engulfing → “B-ENG” above the bar (red).
IB (small orange dot at the top)
Inside Bar (compression). Use the mother bar’s high/low for the break.
PIN (triangle)
Bullish Pin → triangle below the bar (long lower wick; rejection of support).
Bearish Pin → triangle above the bar (long upper wick; rejection of resistance).
Treat these as price-action alerts, not automatic buy/sell signals. Act only when they occur at your levels (VWAP band, Fib 38.2–61.8, PDH/PDL, OB/FVG, etc.).
How to trade the prints (quick rules)
A) Bullish Engulfing at support
Context: at VWAP/VAL/0.5–0.618 Fib.
Entry: next candle above the engulfing high (or market order on close if volume/momentum confirm).
Stop: a tick below the engulfing low (or below the level).
Targets: mid/range, VWAP, prior swing; trail with Chandelier/ATR if trend extends.
B) Bearish Engulfing at resistance
Mirror the above: trigger below the engulfing low; stop above its high.
C) Inside Bar
It’s compression. Mark the mother bar’s high/low.
Trade the breakout in the direction of bias (above VWAP for longs, below for shorts).
If the break fails (closes back inside), often sets up a reversal—manage fast.
D) Pin Bar (rejection)
Enter on break of the pin’s body in the direction away from the wick.
Stop beyond the wick tip (invalidated if wick gets closed through).
Scale at VWAP/mid or the opposite range edge.
What the Inputs do (the panel you showed)
Inside Bar lookback (default 1)
How many bars back can be the mother bar.
Keep 1 for strict IB; raise to 2–3 to catch nested/compression patterns (more signals, a bit noisier).
Pin wick:body min ratio (default 2)
How long the rejection wick must be compared to the body.
Higher (2.5–3.0) = pickier, great in chop.
Lower (1.5–1.8) = more pins, useful in strong trends where wicks are shorter.
Min body % of range (0–1) (default 0.25)
Filters out dojis. The body must be at least 25% of the bar’s high-low range.
If you want to allow slimmer bodies (more pins/dojis), drop to 0.15–0.20.
If you want only decisive bodies, raise to 0.30–0.35.
Suggested tuning by market state
Trending / high momentum:
IB lookback 1, Pin ratio 1.8–2.2, Min body 0.20–0.25 (to catch more continuation entries).
Ranging / choppy:
IB lookback 2, Pin ratio 2.5–3.0, Min body 0.30 (fewer, higher-quality reversals).
A simple confluence checklist (use before clicking)
Signal printed at a level (VWAP band, Fib, PDH/PDL, OB/FVG)?
Bias aligned (above VWAP for longs, below for shorts) or you’re intentionally fading a range edge?
For engulfing: did it close through nearby minor structure?
For IB: are you trading the mother bar break, not just the small inside candle?
Risk defined: stop beyond wick/zone, target mapped (mid/VWAP/swing/extension).
Common pitfalls
Taking signals mid-range (low R:R).
Treating an IB as a reversal without a break/shift.
Buying a bullish pin that closed below your level (no acceptance).
Ignoring volatility—during news spikes, patterns fail more often.

PumpC PAC & MAsPumpC – PAC & MAs (Open Source)
A complete Price Action Candles (PAC) toolkit combining classical price action patterns (Fair Value Gaps, Inside Bars, Hammers, Inverted Hammers, and Volume Imbalances) with a flexible Moving Averages (MAs) module and an advanced bar-coloring system.
This script highlights supply/demand inefficiencies and micro-patterns with forward-extending boxes, recolors zones when mitigated, qualifies patterns with a global High-Volume filter, and ships with ready-to-use alerts. It works across intraday through swing trading on any market (e.g., NASDAQ:QQQ , $CME:ES1!, FX:EURUSD , BITSTAMP:BTCUSD ).
This is an open-source script. The description is detailed so users understand what the script does, how it works, and how to use it. It makes no performance claims and does not provide trade advice.
Acknowledgment & Credits
This script originates from the structural and box-handling logic found in the Super OrderBlock / FVG / BoS Tools by makuchaku & eFe. Their pioneering framework provided the base methods for managing arrays of boxes, extending zones forward, and recoloring once mitigated.
Building on that foundation, I have substantially expanded and adapted the code to create a unified Price Action Candles toolkit . This includes Al Brooks–inspired PAC logic, additional patterns like Inside Bars, Hammers, Inverted Hammers, and the new Volume Imbalance module, along with strong-bar coloring, close-threshold detection, a flexible global High-Volume filter, and a multi-timeframe Moving Averages system.
What it does
Fair Value Gaps (FVG) : Detects 3-bar displacement gaps, plots forward-extending boxes, and optionally recolors them once mitigated.
Inside Bars (IB) : Highlights bars fully contained within the prior candle’s range, with optional high-volume filter.
Hammers (H) & Inverted Hammers (IH) : Identifies rejection candles using configurable body/upper/lower wick thresholds. High-volume qualification optional.
Volume Imbalances (VI) : Detects inter-body gaps where one candle’s body does not overlap the prior candle’s body. Boxes extend forward until wick-based mitigation occurs (only after the two-bar formation completes). Alerts available for creation and mitigation.
Mitigation Recolor : Each pattern can flip to a mitigated color once price trades back through its vertical zone.
Moving Averages (MAs) : Four configurable EMAs/SMAs, with per-MA timeframe, length, color, and clutter-free plotting rules.
Strong Bar Coloring : Highlights bullish/bearish engulfing reversals with different colors for high-volume vs low-volume cases.
Close Threshold Bars : Marks candles that close in the top or bottom portion of their range, even if the body is small. Helps spot continuation pressure before a full trend bar forms.
Alerts : Notifications available for FVG+, FVG−, IB, H, IH, VI creation, and VI mitigation.
Connection to Al Brooks’ PAC teachings
This script reflects Al Brooks’ Price Action Candle methodology. PAC patterns like Inside Bars, Hammers, and Inverted Hammers are not trade signals on their own—they gain meaning in context of trend, failed breakouts, and effort vs. result.
By layering in volume imbalances, strong-bar reversals, and volume filters, this script focuses attention on the PACs that show true participation and conviction, aligning with Brooks’ emphasis on reading crowd psychology through price action.
Why the High-Volume filter matters
Volume is a key proxy for conviction. A PAC or VI formed on light volume can be misleading noise; one formed on above-average volume carries more weight.
Elevates Inside Bars that show absorption/compression with heavy activity.
Distinguishes Hammers that reject price aggressively vs. weak drifts.
Filters Inverted Hammers to emphasize true supply pressure.
Highlights VI zones where institutional order flow left inefficiencies.
Differentiates strong engulfing reversals from weaker, low-participation moves.
Inputs & Customization
Inputs are grouped logically for fast configuration:
High-Volume Filter : Global lookback & multiple, per-pattern toggles.
FVG : Visibility, mitigated recolor, box style/transparency, label controls.
IB : Visibility, require high volume, mitigated recolor, colors, label settings.
Hammer / IH : Visibility, require high volume, mitigated recolor, wick/body thresholds.
VI : Visibility, require high volume, mitigated recolor, box style, labels, mitigation alerts.
Strong Bars : Enable/disable, separate colors for high-volume and low-volume outcomes.
Close Threshold Bars : Customizable close thresholds, labels, optional count markers.
MAs : EMA/SMA type, per-MA toggle, length, timeframe, color.
Alerts
New Bullish FVG (+)
New Bearish FVG (−)
New Inside Bar (IB)
New Hammer (H)
New Inverted Hammer (IH)
New Volume Imbalance (VI)
VI Mitigated
Strong Bullish Engulfing / Bearish Engulfing (high- and low-volume variants)
Suggested workflow
Choose your market & timeframe (script works across equities, futures, FX, crypto).
Toggle only the PACs you actually trade. Assign distinct colors for clarity.
Use MAs for directional bias and higher timeframe structure.
Enable High-Volume filters when you want to emphasize conviction.
Watch mitigation recolors to see which levels/zones have been interacted with.
Use alerts selectively for setups aligned with your plan.
Originality
Builds upon Super OrderBlock / FVG / BoS Tools (makuchaku & eFe) for FVG/box framework.
Expanded into a unified PAC toolkit including IB, H, IH, and VI patterns.
Brooks-inspired design: Patterns contextualized with volume and trend, not isolated.
Flexible high-volume gating with per-pattern toggles.
New VI integration with wick-based mitigation.
Strong Bar Coloring differentiates conviction vs weak reversals.
MTF-aware MAs prevent clutter while providing structure.
Open-source: Transparent for learning, editing, and extension.
Disclaimer
For educational and informational purposes only. This script is not financial advice. Trading carries risk—always test thoroughly before live use.

TFC - HTF1 = Inside Bar
2 = Breaks one side of the previous bar
3 = Breaks both sides of the previous bar
2up Green = Current bar breaks previous bar's high and it is a green bar
2up Red = Current bar breaks previous bar's high but it is a red bar
2Down Green = Current bar breaks previous bar's low but it is a green bar
2Down Red = Current bar breaks previous bar's low and it is a red bar
Inside Green = Current bar is an inside bar (1) and it is a green bar
Inside Red = Current bar is an inside bar (1) and it is a red bar
Outside Green = Current bar is an outside bar (3) and it is a green bar
Outside Red = Current bar is an outside bar (3) and it is red bar
Looking for above setups on Daily, Weekly, Monthly, 3Month, Year
Only higher timeframe data shows up
e.g. If the chart timeframe is 1D or less, all of the above timeframe analysis will appear
If the chart timeframe is 1Month, only 1M, 3M and Yearly analysis will show up
Please DM me for access
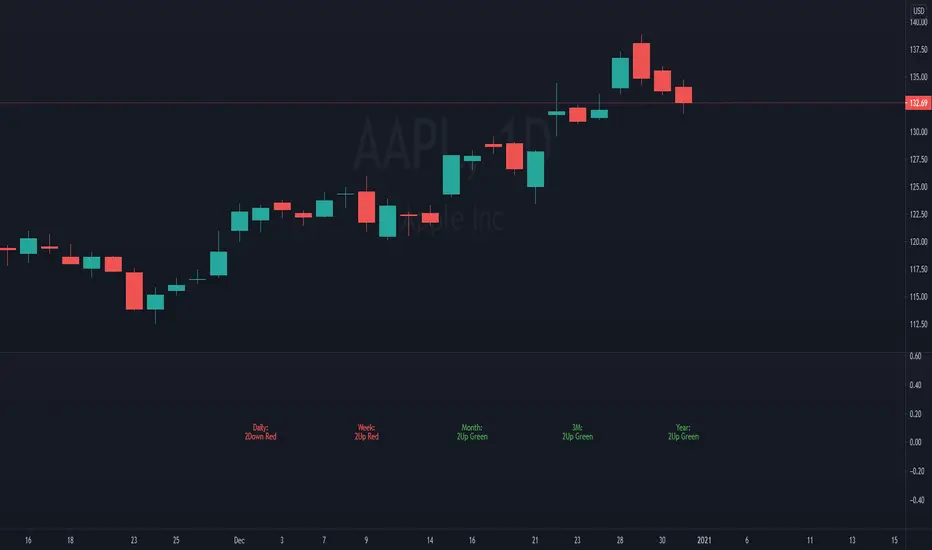
TFC - LTF1 = Inside Bar
2 = Breaks one side of the previous bar
3 = Breaks both sides of the previous bar
2up Green = Current bar breaks previous bar's high and it is a green bar
2up Red = Current bar breaks previous bar's high but it is a red bar
2Down Green = Current bar breaks previous bar's low but it is a green bar
2Down Red = Current bar breaks previous bar's low and it is a red bar
Inside Green = Current bar is an inside bar (1) and it is a green bar
Inside Red = Current bar is an inside bar (1) and it is a red bar
Outside Green = Current bar is an outside bar (3) and it is a green bar
Outside Red = Current bar is an outside bar (3) and it is red bar
Looking for above setups on 15 Minutes, 30 Minutes, 1 Hour, 2 Hour and 4 Hours
Only higher timeframe data shows up
e.g. If the chart timeframe is M15 or less, all of the above timeframe analysis will appear
If the chart timeframe is H1, only H1, H2 and H4 analysis will show up
Please DM me for access
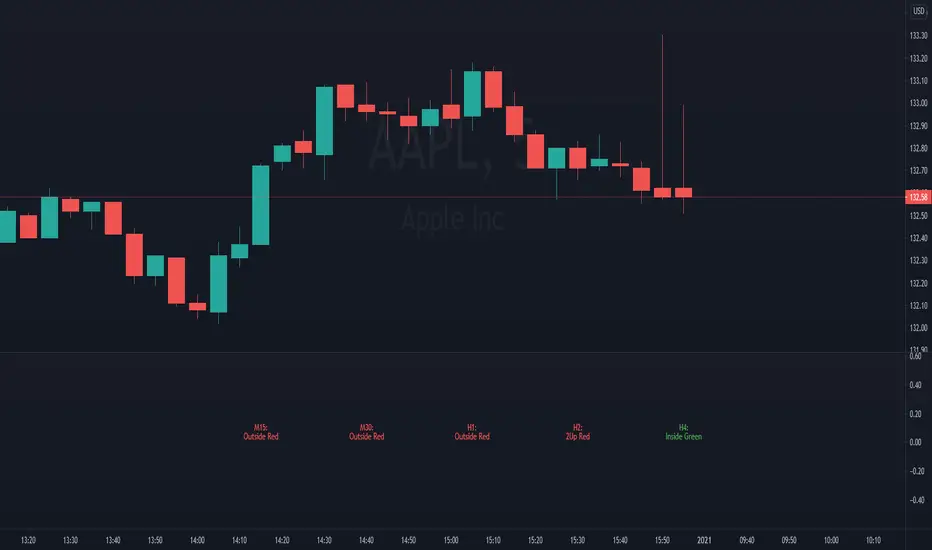
SMC pro trend
The PSK FX Structure Indicator (also known as SMC pro trend) is a complete Smart Money Concepts (SMC) toolkit designed for professional structure traders.
It detects and visualizes key price structure elements such as BoS (Break of Structure), CHoCH (Change of Character), HH/HL/LH/LL, IDM zones, SCOB, sweeps, inside bars, and EMA confluence — all with precise non-repainting logic.
This indicator helps traders read price action like an institution — identifying liquidity shifts, order flow direction, and possible reversal or continuation zones.
⸻
⚙️ Core Features
🧭 Structure Detection
• Automatic detection of major structure points:
• HH – Higher High
• HL – Higher Low
• LH – Lower High
• LL – Lower Low
• Confirms BoS (Break of Structure) and CHoCH (Change of Character) events in both bullish and bearish markets.
• Marks each structure change with labels and connecting lines for clarity.
🔁 BoS / CHoCH Logic
• Solid line = BoS
• Dashed line = CHoCH
• Colored by direction:
• 🟩 Bullish = Green
• 🟥 Bearish = Red
• Option to show live BoS/CHoCH lines extending forward for real-time updates.
🧱 IDM (Internal Displacement Model) Zones
• Detects previous and live IDM zones (premium/discount zones).
• Highlights IDM candles that cause structural displacement.
• Labels each detected IDM level automatically.
⚡ Sweeps (Liquidity Grab Detection)
• Detects when price sweeps previous highs/lows.
• Marks these zones with dotted lines and optional “X” markers.
🧩 SCOB Pattern (Smart Candle Order Block)
• Detects and colors special SMC candle structures:
• Bullish SCOB → Aqua
• Bearish SCOB → Fuchsia
• Option to color all bars by trend direction or only highlight SCOB bars.
🧭 Internal Structure & Pivots
• Marks minor highs/lows (internal structure) for better IDM leg visualization.
• Helps identify early momentum shifts before major structure breaks.
🎯 1.618 Target Projection
• Projects 1.618 Fibonacci targets dynamically after BoS or CHoCH confirmation.
• Displays target price level with text label:
• Bullish → Green Target Line
• Bearish → Red Target Line
🧱 Inside Bar Zones
• Highlights inside bar formations (compression zones).
• Draws colored boxes between high/low of inside bar clusters.
• Marks the first and consecutive inside bars with custom bar colors.
📊 EMA Filter
• Includes a toggleable Exponential Moving Average (EMA) for confluence with trend direction.
• Customizable EMA length (default: 50).
🎨 Monochrome Mode
• Toggle between normal color mode and a clean monochrome theme for minimalistic charting setups.
⸻
🧠 How to Use
1. Identify Market Context:
Wait for a confirmed CHoCH to spot potential reversals or structure shifts.
2. Follow Order Flow:
Confirm trend direction via BoS lines and IDM zones.
3. Entry Planning:
Combine sweep detection, inside bar zones, and IDM levels for sniper entries.
4. Take Profit Zones:
Use the 1.618 target projection line to set high-probability TP levels.
5. Trend Filtering:
Use EMA direction to confirm whether to follow continuation or counter-trend setups.
⸻
🧩 Inputs & Settings
Category
Key Settings
Structure
Equal H/L toggle, HH/LL labeling, internal structure
BoS/CHoCH
Enable/disable labels, custom label size, bull/bear colors
IDM
Show previous/live IDM, label size, color options
Sweeps
Show sweep lines, X-markers, sweep line color
Bar Coloring / SCOB
Toggle bar coloring and SCOB pattern
Inside Bars
Highlight and box compression zones
1.618 Targets
Enable Fibonacci target projection
EMA
Toggle EMA and adjust length
Monochrome Mode
Apply single-color chart theme
⚠️ Notes
• This indicator is built for non-repainting structure confirmation.
• Use it on higher timeframes for swing structure or lower timeframes for IDM entry precision.
• Works best with clean price action charts (no cluttered oscillators or extra visuals).
⸻
💡 Recommended Use Cases
✅ SMC traders
✅ ICT/Order Block strategy users
✅ Liquidity and market structure traders
✅ Scalpers and swing traders using BoS/CHoCH logic
⸻
✍️ Author
Developed by PURNA SAMPATH KALUARACHCHI (PSK FX)
Smart Money Concepts researcher and price structure developer.
⸻

Al Brooks II.IOI.OO# Al Brooks Consecutive Bar Patterns (II/OO/IOI)
## Overview
This indicator automatically identifies Al Brooks' key consecutive bar patterns that signal important market transitions. Enhanced with both **traditional (high/low)** and **body (open/close)** detection methods for more accurate signals.
## Pattern Definitions
### 📊 II Pattern - Double Inside Bars
- **Signal**: Two consecutive inside bars
- **Market Meaning**: Volatility contraction, breakout pending
- **Trading**: Wait for breakout, trade with momentum
### 📊 OO Pattern - Double Outside Bars
- **Signal**: Two consecutive outside bars
- **Market Meaning**: Volatility expansion, trend acceleration or reversal
- **Trading**: Watch for exhaustion at key levels
### 📊 IOI Pattern - Inside-Outside-Inside
- **Signal**: Inside bar → Outside bar → Inside bar sequence
- **Market Meaning**: Market indecision, complex consolidation
- **Trading**: Avoid early entries, wait for clear direction
## Features
✅ **Dual Detection System**
- Traditional: Uses high/low prices (catches wicks)
- Body: Uses open/close prices (focuses on real trading range)
- Combined: Triggers when either condition is met
✅ **Visual Markers**
- Clear labels above/below bars
- Color-coded backgrounds
- Detection source indicators (h=high/low, b=body, +=both)
✅ **Smart Alerts**
- Real-time pattern detection
- Separate alerts for body-only patterns
- Customizable notification settings
## Settings
**Display Options**
- Show/hide each pattern type
- Toggle detection methods
- Customize colors
**Detection Modes**
- High/Low Detection: Traditional wick-based
- Body Detection: Open/Close based
- Show Source: Display what triggered the pattern
## Trading Tips
1. **Best Timeframes**: 1H, 4H, Daily
2. **Combine with**: Volume, trend indicators, support/resistance
3. **Risk Management**:
- II: Tight stops inside pattern
- OO: Wider stops due to volatility
- IOI: Scale in positions
## Label Meanings
- `ii` / `OO` / `ioi` = Base pattern detected
- `+h` suffix = High/Low triggered
- `+b` suffix = Body triggered
- `++` suffix = Both conditions met (strongest signal)
## Author Notes
Based on Al Brooks' price action methodology from his Trading Price Action series. This enhanced version adds body detection to filter out wick-only patterns and reduce false signals.
---
*For educational purposes only. Trading involves risk.*
**Version 2.0** | **Pine Script v6** | **@JimmC98**
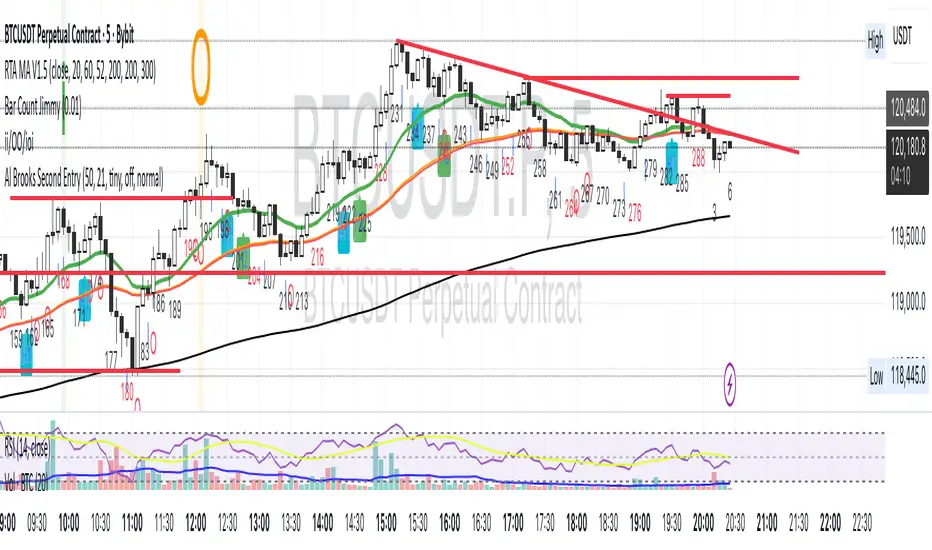
Optimus Trader Consolidation V.1 Indicator Description: "Optimus Trader Consolidation V.1"
This Pine Script indicator is designed to assist traders by identifying key market conditions, including **trend direction**, **volume dynamics**, **liquidity zones**, and **consolidation periods**, alongside candlestick patterns like **Pin Bars** and **Inside Bars**. It provides clear buy and sell signals based on a confluence of these factors. Here’s a detailed breakdown of its functionality:
---
Key Features:
1. **Moving Average (MA) and VWAP Integration**:
- The indicator uses a 50-period Simple Moving Average (SMA) and VWAP (Volume Weighted Average Price) to identify the market trend.
- **Uptrend**: Price is above both the MA and VWAP.
- **Downtrend**: Price is below both the MA and VWAP.
2. **Volume Threshold**:
- A dynamic volume threshold is calculated based on the 20-period SMA of volume, multiplied by a factor of 1.2.
- This ensures signals are filtered to consider only significant volume spikes, avoiding noise from low-volume periods.
3. **Pin Bar Detection**:
- Identifies bullish and bearish Pin Bars based on candlestick characteristics:
- **Bullish Pin Bar**: Large wick above the body, small lower wick, and a green body.
- **Bearish Pin Bar**: Large wick below the body, small upper wick, and a red body.
4. **Inside Bar Detection**:
- Detects Inside Bars, where the current candle’s high and low are fully contained within the previous candle’s range.
- Indicates a period of indecision or potential breakout zones.
5. **Liquidity Zone Identification**:
- Uses recent 20-period highs and lows to approximate liquidity zones.
- Highlights areas where price is near these zones, indicating potential support or resistance.
6. **Buy and Sell Signal Generation**:
- **Buy Signal**: Triggered when a bullish Pin Bar or Inside Bar occurs in an uptrend, with high volume, and near liquidity zones.
- **Sell Signal**: Triggered when a bearish Pin Bar or Inside Bar occurs in a downtrend, with high volume, and near liquidity zones.
- Signals are visually plotted with green (BUY) and red (SELL) markers.
7. **Consolidation Zone Detection**:
- Identifies periods of low price range volatility using a user-defined period (`length`) and range threshold (`range_threshold` in %).
- Highlights periods where the price range is less than the threshold, visually marking consolidation zones.
- Upper and lower boundaries of consolidation zones are plotted with green and red lines, respectively.
8. **Visual Enhancements**:
- Consolidation zones are shaded with a blue background to make them easily recognizable.
- Clear markers for buy and sell signals help traders quickly spot opportunities.
---
Use Cases:
- **Trend Confirmation**: By integrating MA, VWAP, and volume analysis, this indicator helps confirm trends before entering trades.
- **Liquidity Zone Trading**: Identifies price areas where support or resistance may lead to significant price movement.
- **Consolidation Breakouts**: Highlights consolidation zones, which often precede explosive moves, allowing traders to anticipate breakouts.
- **Candlestick Reversal Patterns**: Pin Bars and Inside Bars are powerful patterns that provide early indications of potential reversals or continuation setups.
---
Customizable Parameters:
- **MA Period**: Length of the moving average (default: 50).
- **Volume Threshold**: Sensitivity to volume spikes (default: 20-period SMA × 1.2).
- **Consolidation Period**: Lookback period for identifying consolidation (default: 20).
- **Consolidation Range Threshold**: Maximum percentage range considered as consolidation (default: 1%).
---
Visualization:
- **Green BUY Signals**: Bullish opportunities based on confluence of patterns, trends, and volume.
- **Red SELL Signals**: Bearish opportunities under similar conditions.
- **Consolidation Zones**: Marked by shaded blue backgrounds and clear horizontal lines for high and low boundaries.
- **Dynamic Levels**: Liquidity zones (highs and lows) plotted for added context.
---
Advantages:
- **Confluence of Factors**: Combines trend, volume, and candlestick analysis for robust signal generation.
- **Market State Detection**: Effectively identifies consolidation and breakout conditions.
- **Customizable**: Users can fine-tune parameters for different instruments or trading styles.
---
This indicator is ideal for traders seeking a comprehensive tool to navigate market conditions with precision, leveraging multiple layers of analysis in a single, easy-to-use overlay.